

Recovery & Readiness
Build a Recovery Baseline
A recovery baseline turns HRV and resting heart rate from isolated scores into personal trends. Learn how to measure consistently, establish a normal range, and combine the numbers with sleep, soreness, and performance.

Introduction
A recovery baseline is a personal range built from repeated measurements taken under similar conditions. It tells you what heart-rate variability (HRV), resting heart rate, sleep, soreness, and readiness normally look like for you. Without that range, a single high or low score has little context.
The goal is not to find a universal “good HRV” or a perfect resting heart rate. The goal is to separate ordinary day-to-day variation from a pattern that deserves attention. That requires consistent measurement, enough observations, and a short subjective check. It also requires restraint: recovery metrics can support a training decision, but they cannot diagnose illness, overtraining, or readiness on their own.
This guide gives you a practical baseline protocol, a way to review trends, and clear rules for deciding when a metric should—or should not—change the next workout.
What HRV and Resting Heart Rate Actually Measure
Resting heart rate is the number of heartbeats per minute under resting conditions. HRV measures variation in the time between successive beats. Consumer systems often report a transformed version of RMSSD, a time-domain HRV measure influenced strongly by parasympathetic activity.
The two metrics are related but not interchangeable. Resting heart rate can rise with heat, dehydration, poor sleep, illness, alcohol, anxiety, altitude, medication, and training stress. HRV can shift with many of the same factors and is also highly sensitive to measurement timing, posture, breathing, and signal quality.
Higher HRV is not always better, and lower HRV is not automatically bad. A systematic review and meta-analysis found that autonomic measures can change with positive training adaptation, but similar responses can also appear during overreaching; the authors concluded that additional measures of training tolerance are needed for interpretation (Bellenger and colleagues). That is the central reason to build a multi-signal baseline.
Start With a Stable Measurement Protocol
Measurement consistency matters more than chasing an ideal device. Choose one method and repeat it under comparable conditions.
For a morning protocol:
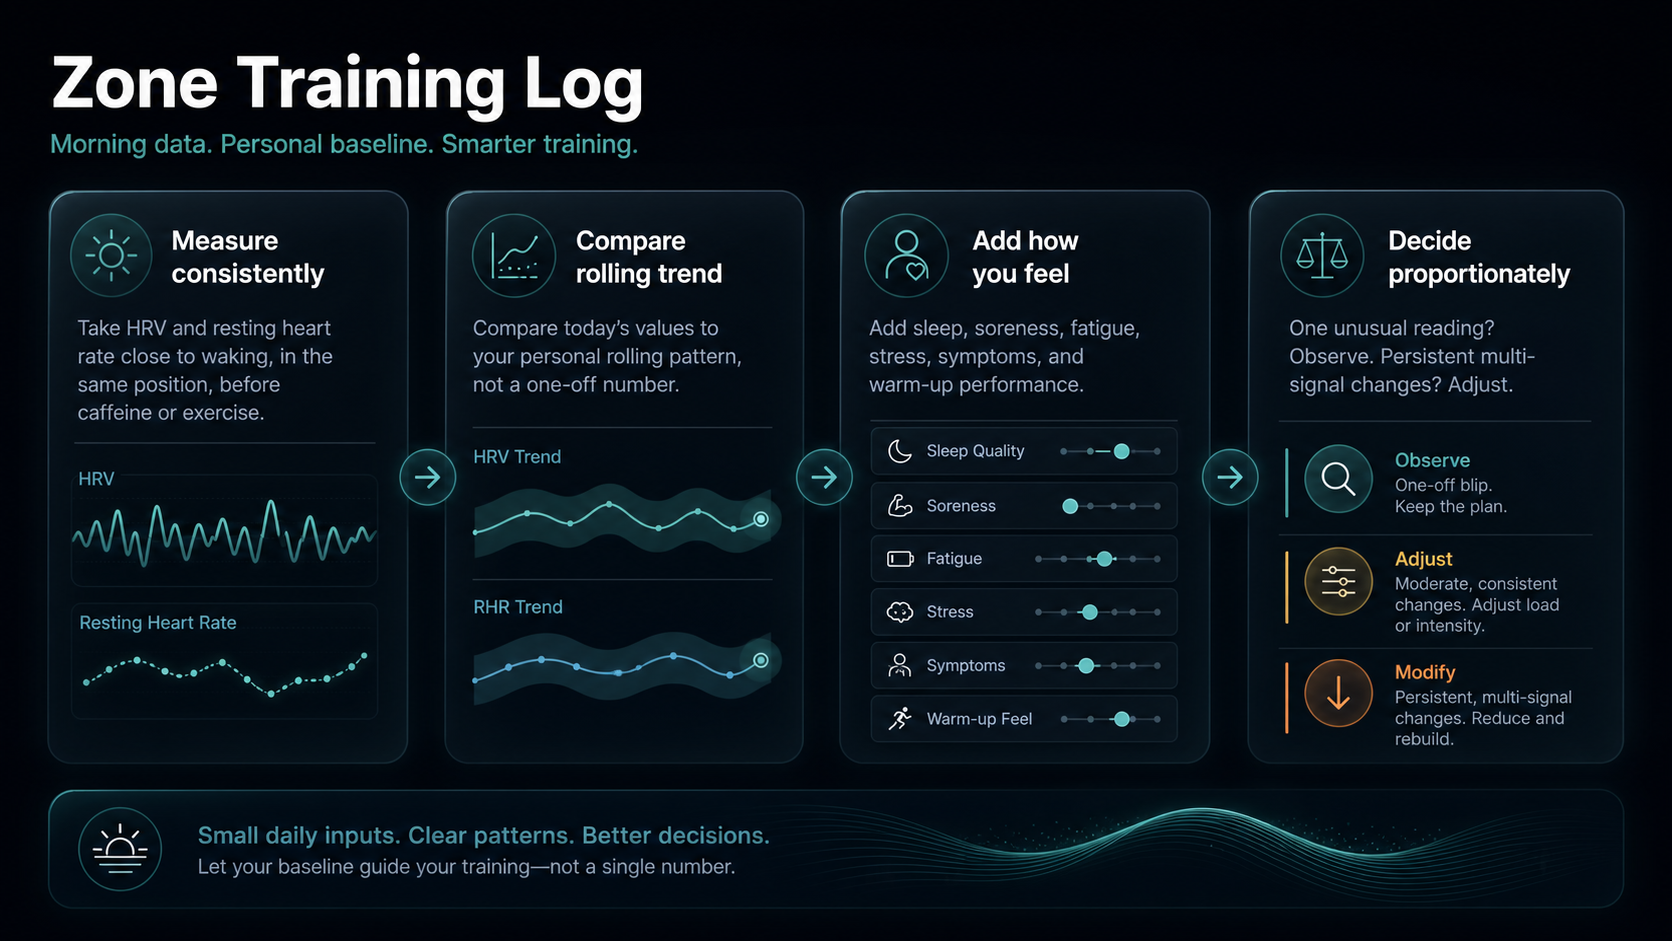
- Measure close to waking.
- Use the same body position each day.
- Measure before caffeine, food, exercise, or a stressful commute.
- Use the same device and app.
- Follow the same recording duration.
- Repeat or discard readings with obvious signal problems.
- Add a 20-second note on sleep, soreness, fatigue, stress, and illness symptoms.
A recent narrative review of mobile HRV monitoring recommends consistent waking measurements, the same posture and routine, and frequent collection; it notes that standardized morning assessments remain one of the most practical field methods (Singh and colleagues). The exact routine matters less than using it reliably.
Nighttime wearable measurements can also be useful. Do not combine nightly HRV from one device with morning spot measurements from another as though they were one continuous series. Different sampling windows and algorithms can produce different values.
How Long Should You Collect Baseline Data?
Collect at least two weeks before making strong interpretations, and prefer three to four weeks when training and life are changing. Include ordinary easy and hard days rather than trying to create a perfectly rested laboratory period.
Seven days can provide an initial reference, but it may capture an unusual week. Longer collection helps reveal your normal weekly rhythm and the effect of long workouts, hard intervals, work stress, and sleep variation.
For HRV, frequency matters. Research in trained triathletes found that averaging at least three valid readings per week captured changes more reliably than one or two isolated measurements, with useful information plateauing after roughly three to four days in that study (Plews and colleagues). In practice, five to seven consistent observations per week make the trend easier to interpret and reduce the chance that one odd reading dominates the story.
Build a Personal Range, Not a Single Target
After the collection period, calculate or use your platform’s rolling average. A seven-day average is intuitive for weekly training, while a longer 21- or 28-day reference changes more slowly. The useful comparison is the recent pattern against your established personal pattern.
You do not need sophisticated statistics to begin. Keep three bands:
- Typical: recent values sit near your personal rolling pattern and other signals are normal.
- Watch: one or two metrics move away from the pattern, but function and symptoms remain acceptable.
- Act: several signals deteriorate, the change persists, or symptoms/performance indicate that normal training is inappropriate.
Avoid hard universal cutoffs. Wearable-derived HRV can vary naturally from day to day, and the amount of normal variation differs between people. Research on individual HRV responsiveness emphasizes personal baselines and typical error rather than team or population averages (Flatt and colleagues).
For resting heart rate, a change of several beats may matter when it persists and aligns with poor sleep, illness symptoms, dehydration, or increased effort. The same change may be unremarkable after a hot night or a measurement taken in a different posture. Context determines whether the deviation is actionable.
Add the Signals a Wearable Cannot Know Reliably
A good baseline includes subjective information because how you feel can be more responsive to training stress than many objective markers. A systematic review comparing athlete-monitoring methods found that subjective well-being measures often reflected acute and chronic training load more sensitively and consistently than objective measures (Saw, Main, and Gastin).
Use a short daily check:
- Sleep quality: poor, normal, or good.
- General fatigue: low, normal, or high.
- Muscle soreness: low, normal, or high.
- Stress or mood: better, normal, or worse.
- Illness symptoms: none, mild, or concerning.
- Motivation to train: normal or notably reduced.
This should take less than a minute. A detailed questionnaire that you stop completing after four days is less useful than five simple fields you record consistently.
Separate Measurement Noise From a Real Pattern
Before changing training, ask five questions.
Was the measurement taken normally?
Different posture, timing, device, caffeine, interrupted sleep, or poor sensor contact can explain an isolated value.
Is the change present for more than one day?
One unusual reading is often noise or a short-lived response. Repeated deviation deserves more attention.
Do HRV and resting heart rate agree?
They do not have to move together. Agreement strengthens the signal; disagreement increases the need for context.
Do subjective signals agree?
Poor sleep, unusual fatigue, soreness, low motivation, and illness symptoms make an objective change more meaningful.
Does performance agree?
Warm-up feel, pace or power at an easy heart rate, coordination, and perceived effort reveal whether the athlete can execute the planned session.
When the signals disagree, choose the safer reversible action: extend the warm-up, reduce the session, move intensity by a day, or perform easy aerobic work. Do not use a single wearable score to justify hard training in the presence of concerning symptoms.
A Practical Decision Framework
Green: continue as planned
Recent HRV and resting heart rate are within your normal pattern, sleep and soreness are acceptable, and the warm-up feels normal. Train as planned while remaining responsive to how the session develops.
Yellow: modify or observe
One metric is unusual, sleep was poor, or fatigue is elevated, but there are no concerning symptoms. Consider reducing volume, keeping the session easy, or using a longer warm-up. Record the result and recheck the next day.
Red: recover or seek guidance
Multiple signals have deteriorated, the pattern persists, performance is unexpectedly poor, or illness/injury symptoms are present. Recovery may be more useful than forcing the plan. Seek medical guidance for chest pain, fainting, severe shortness of breath, a new irregular heartbeat, or other concerning symptoms.
This framework is intentionally conservative and non-diagnostic. It converts imperfect evidence into proportionate decisions.
How to Use the Baseline With Training Load
Recovery data becomes more useful when you can see the preceding training. Compare the recent week with your longer baseline using acute versus chronic training load, then record session duration, perceived effort, intensity distribution, and key workout notes. Ask how your signals behave after different types of load.
You may discover that:
- HRV commonly falls after late high-intensity sessions but normalizes within two days.
- Resting heart rate rises after hot long workouts or travel.
- Soreness responds more strongly to downhill running than cycling intervals.
- Sleep quality predicts difficult workouts better than either heart-rate metric.
- A cluster of changes appears only after several high-load weeks.
These personal patterns are more actionable than comparing your HRV with another athlete. They also prevent normal post-workout disturbance from being mistaken for a crisis.
Rebuild the Baseline When Conditions Change
Your baseline is not permanent. Reassess it after:
- several weeks away from training;
- illness or injury;
- a major training-phase change;
- altitude exposure;
- a new medication affecting heart rate;
- pregnancy or major hormonal change;
- a new device or measurement method;
- a significant change in sleep schedule.
Do not splice incompatible devices or methods into one trend without marking the transition. Start a new reference period and preserve the old data for context.
Review the Baseline Weekly, Not Only When It Looks Bad
A baseline becomes more useful when it is part of a regular weekly review. Waiting for a red readiness score encourages reactive decisions and makes normal variability feel alarming.
Once a week, place recovery and training information on the same timeline:
- Mark the long and high-intensity sessions.
- Note unusually stressful work, travel, alcohol, poor sleep, heat, or illness exposure.
- Review the seven-day HRV and resting-heart-rate trends.
- Review fatigue, soreness, sleep, stress, and motivation.
- Check whether easy-session pace or power changed at a similar effort.
- Decide whether the coming week should proceed, progress, or remain stable.
This review prevents a predictable response from being mislabeled as a problem. If HRV commonly changes the morning after intervals and returns toward baseline within 48 hours, the pattern may represent an ordinary response for you. If the same change begins to persist for four days and is joined by poor sleep and declining easy-session performance, the combined pattern deserves a different decision.
Keep the review descriptive before making it prescriptive. Write what happened, list plausible explanations, and then choose the smallest useful adjustment. This reduces the temptation to invent certainty from a noisy chart.
An Example of Multi-Signal Interpretation
Imagine that your resting heart rate is six beats above its rolling pattern on Monday morning and HRV is below its recent range.
If Sunday included a hot two-hour run, sleep was interrupted, and Monday is already planned as easy, record the context and proceed conservatively. Rehydrate, extend the warm-up, and recheck the trend the next morning.
Now imagine that the same pattern continues through Thursday. Sleep remains poor, normal pace feels harder, soreness is increasing, and you have mild illness symptoms. The original Monday reading was not proof of a problem, but the persistent multi-signal pattern now supports reducing training and considering medical guidance.
The reverse can also happen. A readiness score may look normal while motivation, movement quality, and performance deteriorate. Do not let one reassuring number overrule several practical warnings. A baseline is valuable because it organizes evidence; it should never silence symptoms or judgment.
Common Baseline Mistakes
Looking for a population “good” score
HRV varies substantially between people. Your consistent trend is usually more useful than a leaderboard.
Measuring only after hard workouts
Selective measurement creates a biased reference. Include ordinary days.
Reacting to every red number
A baseline is meant to reduce overreaction. Look for agreement, persistence, and functional impact.
Ignoring subjective data
Wearables cannot fully observe soreness, motivation, pain, or the quality of a warm-up.
Treating readiness as diagnosis
HRV and resting heart rate do not diagnose overtraining, infection, cardiac disease, or mental-health conditions.
Changing the protocol repeatedly
An imperfect consistent method produces a more interpretable trend than a theoretically ideal method that changes every week.
A Four-Week Setup Plan
Week 1: establish the routine
Measure at the same time and position. Record sleep, fatigue, soreness, stress, symptoms, and the previous day’s training.
Week 2: protect consistency
Continue measuring. Do not adjust training from small isolated deviations unless symptoms or function justify it.
Week 3: identify repeatable responses
Review how the metrics behave after long, hard, easy, and rest days. Note obvious environmental explanations.
Week 4: define your decision bands
Write down what typical, watch, and act look like for you. Include objective metrics, subjective signals, and warm-up performance. Keep the rules simple enough to use on a busy morning.
After four weeks, continue updating the rolling baseline. The goal is not to graduate from measurement; it is to make the interpretation calmer and more personal.
Conclusion
A useful recovery baseline comes from consistent measurements, enough observations, and multiple signals. Measure HRV and resting heart rate under similar conditions, compare recent trends with your own history, and pair the numbers with sleep, fatigue, soreness, symptoms, and workout execution.
The baseline should make decisions less dramatic. Most isolated changes deserve observation, not panic. Persistent multi-signal changes deserve a proportionate adjustment. Concerning symptoms deserve professional care regardless of what a readiness score says.
For the next step, read Sleep and Endurance Adaptation to understand how sleep supports the recovery signal, then read Why Your Recovery Metrics Change After Hard Training. Use the Resting Heart Rate Calculator to keep the discussion anchored to a repeatable measurement rather than a single alarming morning.

Our editorial approach & AI disclosure
We use AI to help research, organize, and draft some articles. Every article is reviewed by a human editor and aims to reflect current evidence-based training practices and scientific literature.
Read our editorial policy