

Recovery & Readiness
Why Your Recovery Metrics Change After Hard Training
Recovery metrics move after hard workouts because your nervous system, muscle damage, sleep, hydration, and inflammation are all responding at different speeds. Learn what those changes mean and when they should alter training.

Introduction
Recovery metrics change after hard training because hard training is supposed to disturb the body. A low HRV score, higher resting heart rate, worse sleep estimate, elevated soreness, or lower readiness score is often not a sign that the workout was wrong. It is a sign that your nervous system, muscles, connective tissue, fluid balance, immune system, and sleep are responding to stress.
The problem is that consumer recovery dashboards compress several signals into one simple verdict. That can make a normal response feel like a warning. It can also make athletes ignore useful information when the score looks fine but their legs, mood, or performance say otherwise.
The practical answer is simple: recovery metrics are context tools, not truth meters. They are most useful when you compare them with your own baseline, your recent training load, and how you feel during the warm-up. To separate a short-term spike from the workload you have built over several weeks, compare acute and chronic training load. Reviews of athlete monitoring consistently point toward multi-measure interpretation rather than relying on one number. A systematic review and meta-analysis found that autonomic heart-rate measures such as HRV can help monitor training status, but they are not standalone diagnostic tools (Bellenger and colleagues). A separate review on training load and fatigue emphasized that no single marker captures the whole fatigue state (Halson).
This article explains why common recovery metrics move after hard sessions, why different metrics can disagree, and how to decide whether a bad-looking morning should change your training plan.
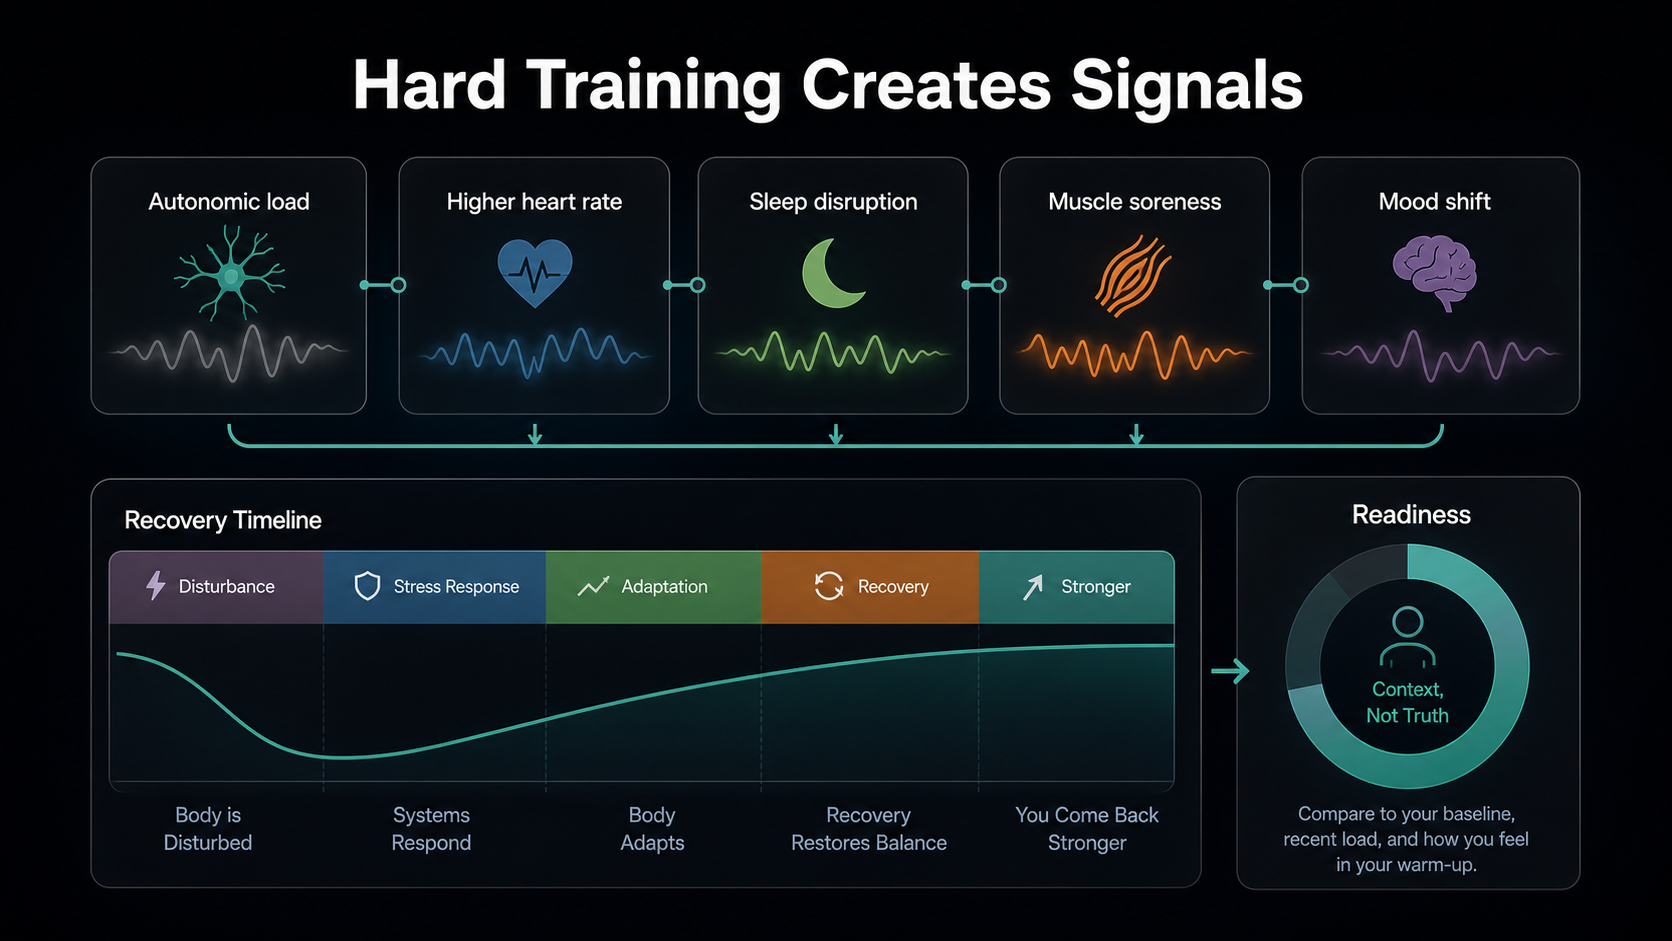
Hard Training Creates a Normal Disturbance
Training works by creating a stress response that the body can repair and adapt to. A hard hill session, long run, race simulation, heavy strength day, or big mountain effort changes the internal environment. The body has to restore fluid balance, replenish fuel, repair damaged tissue, normalize temperature, regulate inflammation, and shift the autonomic nervous system back toward rest.
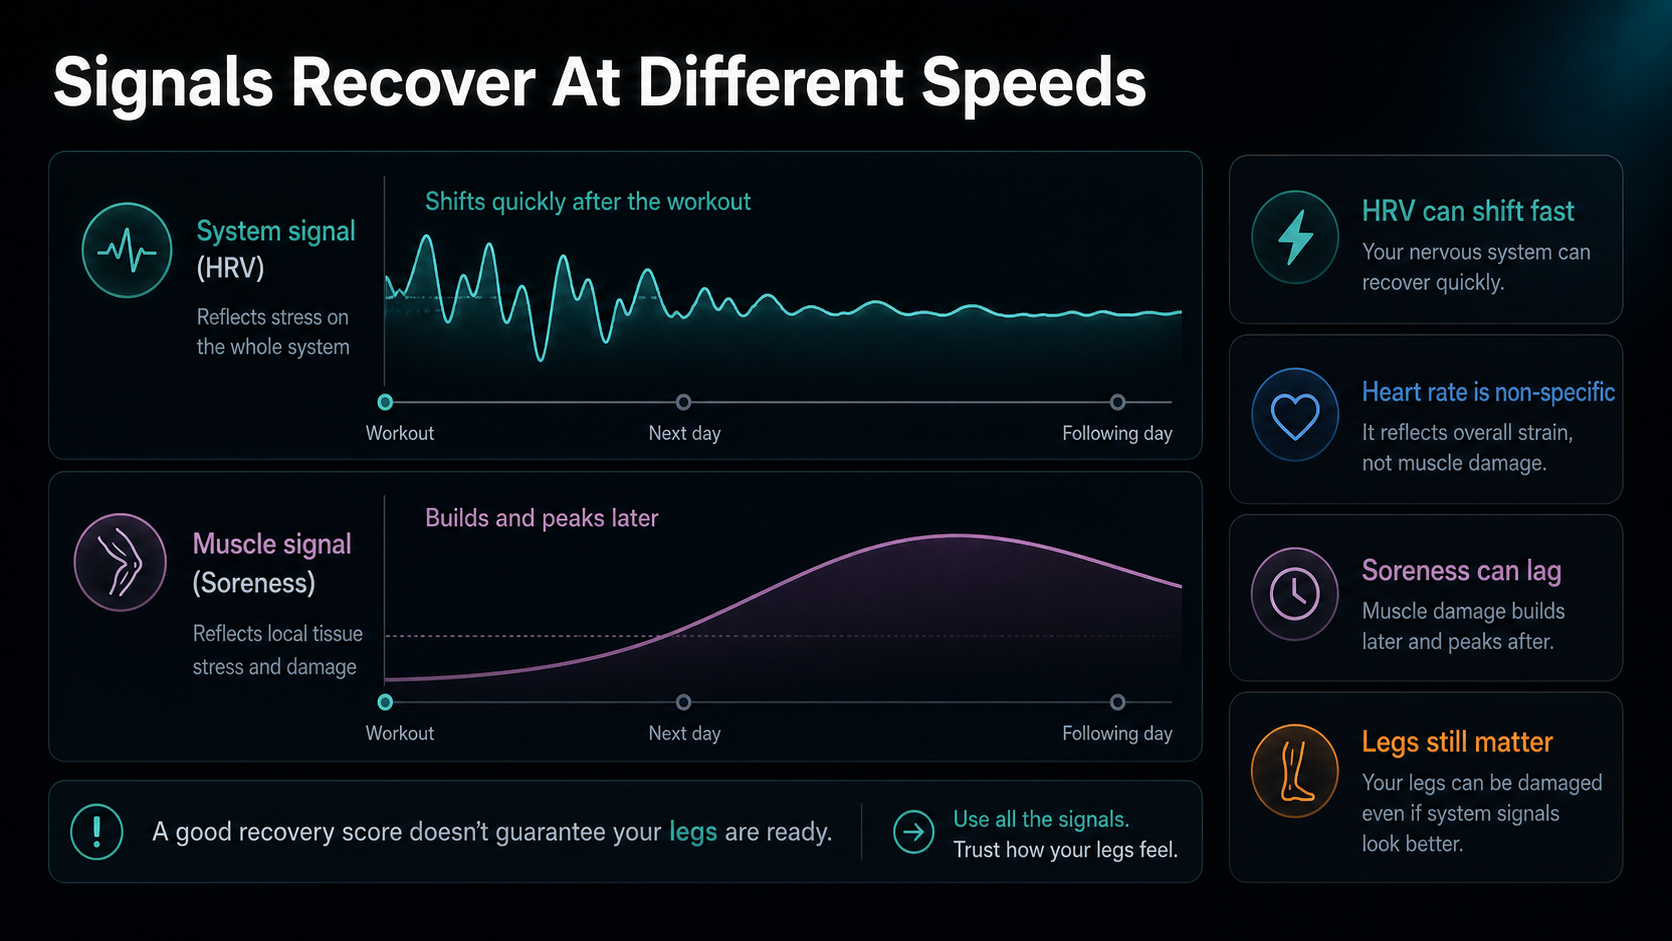
That process is not instant. Some signals change within minutes. Some peak the next morning. Some lag for 24-72 hours. This is why a workout can feel good, then make your recovery dashboard look bad the next day, then create soreness two days later.
Recovery and readiness are also not the same thing. Recovery is the process of returning from stress. Readiness is whether you are prepared for the next specific task. You might be recovered enough for an easy Zone 2 run but not ready for threshold intervals. You might feel mentally fresh but still have heavy legs from downhill eccentric loading. The consensus statement on recovery and performance in sport defines recovery as a multifactorial process involving physiological and psychological restoration, not a single measurable switch (Kellmann and colleagues).
This matters because a lower score after hard training is not automatically bad. If the session was planned, the load was appropriate, and the next day is easy, a dip may simply confirm that you created stress. The concern is not one dip. The concern is a pattern: metrics remain suppressed, subjective fatigue rises, performance drops, and the athlete keeps adding load anyway.
HRV Drops When the Autonomic System Is Still Loaded
Heart rate variability, or HRV, describes variation in timing between heartbeats. It is often used as a window into autonomic regulation: the balance and interaction between sympathetic activation, parasympathetic activity, respiration, baroreflexes, and other control systems. The classic HRV standards paper set out measurement and interpretation principles long before modern wearables made HRV a daily consumer metric (Task Force).
After hard training, HRV often decreases because the body is still dealing with stress. High-intensity work, heat, dehydration, poor sleep, alcohol, emotional stress, illness, and heavy muscle damage can all reduce parasympathetic influence or raise sympathetic drive. The morning number may therefore reflect more than the workout itself.
Exercise-recovery research describes parasympathetic reactivation as a meaningful part of post-exercise recovery. The rate at which parasympathetic activity returns after exercise depends on intensity, duration, fitness, hydration, heat, and accumulated fatigue (Stanley, Peake, and Buchheit). That is why an easy aerobic day may barely affect next-morning HRV, while a hard interval session or race can shift it substantially.
The confusing part is that HRV does not always fall in a clean way. In some athletes, unusually high HRV can appear during heavy fatigue or parasympathetic saturation. Some athletes have naturally large day-to-day variation. Others are stable. Work in elite endurance athletes has emphasized individual baselines and athlete-specific patterns rather than universal cutoffs (Plews, Laursen, Stanley, Kilding, and Buchheit). A study of world-champion rowers also highlighted that individual characteristics matter when interpreting day-to-day HRV (Plews, Laursen, and Buchheit).
Use HRV as a trend signal. A single low reading after a hard session is usually just information. Several low readings combined with poor sleep, irritability, rising resting heart rate, and bad warm-up sensations deserve more respect.
Resting Heart Rate Often Rises For Practical Reasons
Resting heart rate is easier to understand than HRV, but it is not simpler physiologically. It can rise after hard training for several reasons:
- The autonomic system remains more activated.
- Core temperature stays elevated.
- Plasma volume and hydration status shift.
- Glycogen restoration pulls water back into muscle.
- Inflammation and tissue repair increase metabolic demand.
- Sleep is shorter or more fragmented.
- Illness is beginning.
That makes resting heart rate useful but non-specific. A higher morning heart rate does not tell you exactly what is wrong. It tells you that your body is working harder than usual at rest.
For endurance athletes, the most useful pattern is the combination of elevated resting heart rate and suppressed performance at easy output. If your normal easy pace or power suddenly requires a higher heart rate and feels harder, the body may not be ready for more intensity. If resting heart rate is up but the warm-up feels normal and the planned day is easy, you may only need to reduce optional extras.
Resting heart rate can also drift for reasons unrelated to training: heat, altitude, menstrual cycle phase, alcohol, late meals, anxiety, medications, and travel. This is another reason to compare against your own baseline instead of a generic "good" number.
Sleep Metrics Move Because Training Changes Sleep Pressure and Arousal
Hard training can improve sleep pressure, but it can also disturb sleep when the dose, timing, heat, fueling, or stress is poorly matched. Late intervals, evening races, long travel days, dehydration, under-fueling, and caffeine all change the conditions for sleep.
Sleep is relevant because it affects recovery, performance, mood, immune function, and readiness. Athlete consensus recommendations treat sleep as a core recovery and health factor, while emphasizing individual sleep needs and practical sleep opportunity (Walsh and colleagues). A 2023 review also summarizes the relationship between sleep and sport performance, including the performance risks of sleep loss (Fullagar and colleagues).
The wearable sleep score, however, is not the same as sleep itself. Consumer devices can be useful for estimating sleep duration and consistency, but they are imperfect. A systematic review and meta-analysis of wristband Fitbit models found that these devices generally perform better for detecting sleep than for detecting wake after sleep onset or classifying sleep stages precisely (Haghayegh and colleagues). Newer smart rings and sensors may improve some measures, but device outputs still need validation and context; a systematic review of smart rings in clinical medicine reflects the rapid growth of the field and the need to understand what each device has actually been validated to measure (Gong and colleagues).
For athletes, the actionable questions are basic:
- Did I get enough sleep opportunity?
- Did training end too close to bedtime?
- Did I use caffeine late?
- Did I under-fuel after the session?
- Is poor sleep repeating across the week?
If the device says sleep was bad but you feel fine and the plan is easy, do not panic. If the device says sleep was fine but you woke repeatedly, feel flat, and your warm-up is poor, trust the broader pattern.
Soreness and Muscle Damage Lag Behind the Workout
Soreness is a delayed signal. It is especially common after downhill running, heavy lifting, plyometrics, faster running than usual, technical descents, or any session with a large eccentric component. Eccentric loading means muscles are producing force while lengthening, which creates a strong mechanical stress.
Delayed onset muscle soreness usually appears after the session rather than during it. Reviews describe DOMS as a complex response involving muscle damage, inflammation, swelling, pain sensitivity, and reduced range of motion, with symptoms commonly peaking later rather than immediately (Cheung, Hume, and Maxwell).
This lag explains why your recovery score may look acceptable the morning after a race, but your legs feel worse the following day. It also explains why HRV and soreness can disagree. HRV may reflect autonomic strain from the whole system, while soreness reflects local tissue stress. A brutal downhill race can leave the legs damaged even if the cardiovascular system looks less disturbed than expected.
Blood markers such as creatine kinase can rise after muscle damage, but they are variable between athletes and are not practical daily tools for most endurance athletes. A review of creatine kinase monitoring in sports medicine notes both its relevance to muscle damage and the many interpretive complications around individual variability, exercise type, and timing (Brancaccio, Maffulli, and Limongelli).
The training implication is straightforward: do not let a normal readiness score talk you into hard running on legs that are mechanically beaten up. If soreness changes stride mechanics, reduces range of motion, or makes descents awkward, choose easy aerobic work, cycling, hiking, mobility, or rest.
Mood and Motivation Often Change Before Performance Does
Athletes often want objective data because subjective feelings seem unreliable. But self-reported measures are not fluff. They can be sensitive, low-cost indicators of training response.
A systematic review by Saw, Main, and Gastin found that subjective self-reported measures often reflected athlete training response at least as well as commonly used objective measures, and in many cases were more responsive (Saw, Main, and Gastin). That does not mean feelings are always correct. It means mood, stress, sleep quality, soreness, and perceived fatigue contain useful information.
This is easy to see in endurance training. Before performance clearly drops, athletes often notice small changes:
- They procrastinate before sessions they usually enjoy.
- Easy runs feel mentally noisy.
- They become unusually irritable about minor discomfort.
- They dread intensity even when the body can still produce the numbers.
- They feel flat during strides or warm-ups.
Those signs matter most when they repeat. Everyone has one low-motivation day. But several days of low mood, poor sleep, rising soreness, and worsening metrics during a high-load block may be an early warning that the training stress is exceeding recovery capacity.
Why Different Metrics Disagree
Recovery metrics disagree because they do not measure the same thing.
HRV is influenced by autonomic regulation and measurement conditions. Resting heart rate reflects cardiovascular and systemic strain but is non-specific. Sleep estimates reflect device algorithms and actual behavior. Soreness reflects local tissue stress and pain sensitivity. Mood reflects psychological stress, training monotony, life load, and recovery state. Performance in the warm-up reflects the integrated athlete on that day.
Different signals also recover at different speeds. After hard intervals, autonomic strain may show up quickly. After downhill running, soreness may peak later. After a late race, sleep may be the first obvious casualty. After several weeks of monotony, mood may deteriorate before resting heart rate changes.
This is why a dashboard can say "recovered" while your legs disagree, or why HRV can look poor even though an easy spin feels fine. The metric is not necessarily wrong. It may be answering a different question than the one you are asking.
A useful monitoring system therefore combines:
- Training load: what you did
- Physiological metrics: how the body responded
- Subjective markers: how you feel
- Performance context: how the warm-up and session behave
- Trend duration: whether this is one day or a pattern
The overtraining consensus statement from the European College of Sport Science and the American College of Sports Medicine emphasizes that overtraining syndrome is complex and cannot be diagnosed from a single simple marker (Meeusen and colleagues). Most athletes reading a recovery dashboard are not dealing with overtraining syndrome. But the same principle applies at a smaller scale: one metric is not enough.
The Difference Between Productive Fatigue and Warning Fatigue
Productive fatigue is expected. If you finish a hard block and every metric looks perfect, the block may not have been very demanding. A well-designed training cycle includes stress, recovery, and adaptation. The goal is not to keep the recovery score high every day. The goal is to place stress where it belongs and recover before the next key stimulus.
Productive fatigue usually looks like this:
- Metrics dip after known hard sessions.
- Easy days feel manageable.
- Sleep returns to normal within a few nights.
- Soreness improves predictably.
- Motivation is mostly intact.
- Performance rebounds after recovery.
Warning fatigue looks different:
- Metrics stay abnormal for several days.
- Easy sessions feel harder than expected.
- Resting heart rate remains elevated.
- HRV remains suppressed or unusually unstable.
- Mood and motivation deteriorate.
- Soreness changes mechanics or persists.
- Performance drops despite reduced load.
- Illness signs appear.
The difference is not one number. It is the direction and duration of the pattern.
For Zone Training Log users, this is where time-in-zone history helps. If recovery metrics are down after a clear spike in Zone 4/5 work, a long climb, or a heavy strength session, the response makes sense. If recovery metrics are down after a week that looked easy, the missing stress may be sleep, heat, work, travel, illness, under-fueling, or emotional load.
Different Workouts Move Different Metrics
Not all hard sessions create the same recovery profile. This is one reason athletes get confused when the same device reacts differently to different kinds of hard work.
Short intervals often create a strong autonomic signal. A session with repeated Zone 5 efforts, short recoveries, and high psychological arousal can push HRV down and resting heart rate up the next morning even if the legs do not feel especially damaged. The cardiovascular and nervous-system load is obvious, but local soreness may be mild.
Long steady endurance work can create a quieter but broader fatigue signal. A three-hour ride, long Zone 2 run, or all-day hike may not produce the sharpest HRV drop, especially in a well-trained athlete, but it can deplete glycogen, disturb hydration, increase sleep need, and create heavy legs. If the long session was hot, under-fueled, or finished late, sleep and resting heart rate may change more than expected.
Downhill running and technical trail work often create delayed local soreness. The aerobic load may look moderate on paper, but eccentric braking can stress quadriceps, calves, and connective tissue. The recovery dashboard might not fully capture the mechanical cost. This is why a trail race can leave an athlete unable to run normally even when the cardiovascular score looks acceptable.
Heavy strength training creates another pattern. A low-repetition strength session may not generate much heart-rate load, but it can produce neuromuscular fatigue and soreness that affects running mechanics. A hypertrophy-style session with more total work can create more muscle damage and soreness. Neither case is well summarized by time in heart-rate zones.
Heat changes everything. A normal workout in hot conditions can raise cardiovascular strain, fluid loss, perceived effort, and sleep disruption. The same pace, power, or heart-rate zone may create a larger recovery cost because thermoregulation is part of the stress.
Fueling also changes the signal. Under-fueled hard sessions can feel successful in the moment but create higher strain later through poor glycogen restoration, increased hunger, worse sleep, and higher perceived effort the next day. A recovery metric may then look like a mysterious readiness problem when the simpler explanation is that the workout cost more than the athlete replaced.
The useful question is not "Why did my score change?" but "Does the kind of score change match the kind of session I did?" If the answer is yes, the response may be normal. If the answer is no, look for hidden stressors.
A Simple Example Week
Imagine two athletes with the same low recovery score on Wednesday morning.
Athlete A ran threshold intervals on Tuesday evening, ate late, slept six hours, and has a slightly elevated resting heart rate. Their legs feel okay, but the warm-up is heavy. The score makes sense: late intensity plus short sleep created a systemic recovery cost. The best decision is probably to keep Wednesday easy and move the next quality session if the warm-up stays poor.
Athlete B did an easy run on Tuesday, slept normally, and reports no soreness, but HRV is low for the third day in a row, resting heart rate is rising, and they feel unusually irritable. The training log does not explain the change. That pattern points away from normal post-workout fatigue and toward hidden stress: illness, work stress, poor energy intake, travel, or accumulated load from previous weeks.
The number is the same. The interpretation is different because the context is different.
This is why recovery metrics should live beside the training log, not above it. The log tells you what stress you applied. The metrics tell you how your body appears to be responding. The subjective notes tell you whether the response is affecting the athlete who has to train today.
How to Respond to a Bad Recovery Morning
Start by asking what the metric is responding to. Did you train hard yesterday? Did you go long? Did you run downhill? Did you finish late? Was it hot? Did you sleep poorly? Did you eat enough after the session?
Then use the planned workout as the filter. A poor recovery reading matters more before a key session than before an easy aerobic day.
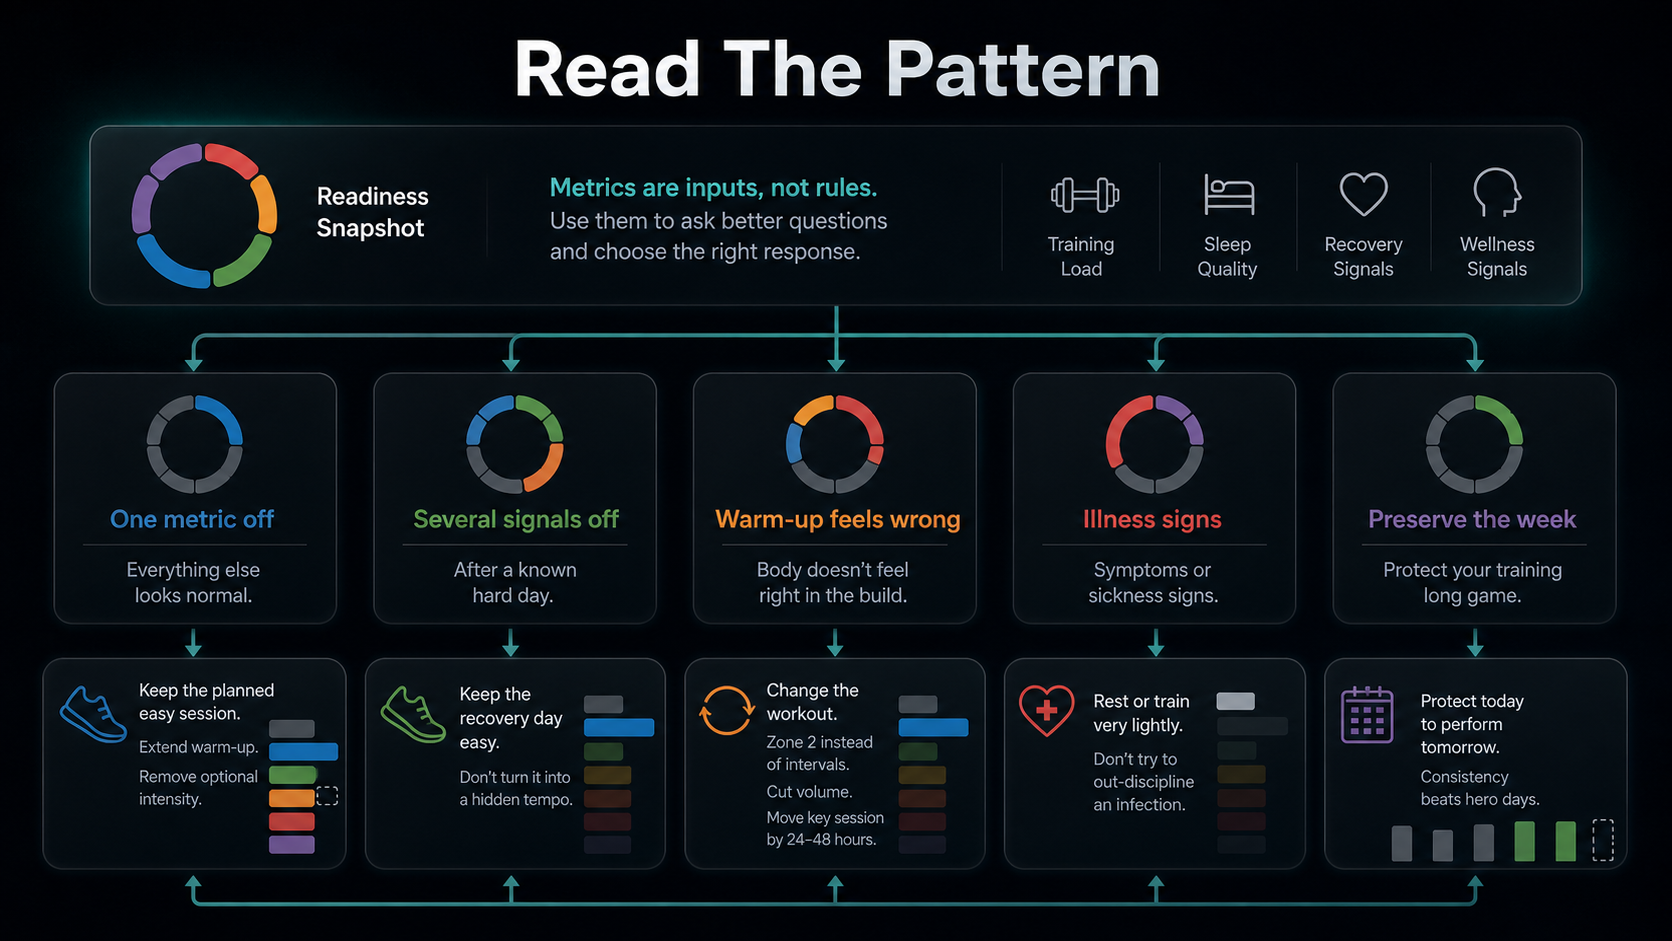
Use this practical decision model:
If one metric is off but everything else is normal: keep the planned easy session, extend the warm-up, and remove optional intensity.
If several metrics are off after a known hard day: keep the recovery day easy. Do not convert it into a hidden tempo session just because the legs loosen up.
If metrics are off and the warm-up feels wrong: change the workout. Replace intervals with Zone 2, cut volume, or move the key session by 24-48 hours.
If metrics are off with illness signs: rest or train very lightly. Do not try to out-discipline an infection.
If metrics are off for a week despite reduced training: review sleep, energy intake, life stress, heat exposure, and overall load. If performance and wellbeing keep declining, consider professional support.
This is not about obeying a device. It is about using the device to ask better questions.
Build a Better Recovery Baseline
Recovery metrics improve when your measurement routine is boring. HRV is especially sensitive to timing, posture, breathing, alcohol, sleep, illness, and measurement method. The HRV standards paper and later athlete-monitoring literature both make the same practical point: measurement conditions matter (Task Force, Plews and colleagues).
For better signal quality:
- Measure at a consistent time, ideally after waking.
- Use the same device and method.
- Compare to your own rolling baseline.
- Track the workout that came before the reading.
- Note illness, alcohol, travel, heat, altitude, and unusual stress.
- Look at weekly patterns, not isolated alerts.
Do not change your training philosophy every morning. Use recovery data to make small, context-aware adjustments: reduce intervals, shift a long run, keep an easy day truly easy, or stop adding extras when the trend says you are already loaded. After a longer interruption, use those signals inside a staged return-to-training framework rather than treating one green score as permission to resume normal load.
Common Interpretation Mistakes
The first mistake is treating a low score as failure. Hard training should create measurable stress. A temporary dip after a planned key session can be normal.
The second mistake is treating a high score as permission. Good HRV does not guarantee that tendons, muscles, or bones are ready for impact. If your calves are sore after downhill running, a readiness score cannot inspect tissue tolerance.
The third mistake is comparing your HRV to someone else's. HRV is highly individual. Your useful range is your own baseline, not a leaderboard number.
The fourth mistake is ignoring non-training stress. Work pressure, travel, poor sleep, alcohol, heat, and emotional stress can move recovery metrics even when training load is low.
The fifth mistake is chasing the score instead of the adaptation. The point of recovery monitoring is not to maximize readiness every day. It is to place hard training, absorb it, and arrive prepared for the next key session.
What Recovery Metrics Can and Cannot Tell You
Recovery metrics can tell you that the body is responding to stress. They can show trends you might miss. They can help protect easy days from becoming too hard. They can reveal that a planned workout is badly timed.
They cannot tell you exactly which tissue is repaired. They cannot diagnose overtraining, illness, or injury by themselves. They cannot know your race goals, your history, your fueling, or whether yesterday's hard session was intentional. They also cannot replace honest feedback from the warm-up.
The best use is integration:
- Use training logs to identify the stress.
- Use HRV and resting heart rate to monitor systemic response.
- Use sleep and mood to understand recovery capacity.
- Use soreness to respect local tissue stress.
- Use warm-up performance to decide the final session.
When those signals agree, the decision is easy. When they disagree, choose the option that preserves the week, not the option that wins the morning.
Conclusion
Recovery metrics change after hard training because hard training creates real physiological disturbance. HRV, resting heart rate, sleep, soreness, mood, and readiness scores each capture different pieces of that response, and each piece moves on its own timeline.
The goal is not to keep every metric green. The goal is to understand whether the response matches the training you planned. A short dip after a hard session can be productive fatigue. A persistent pattern across metrics, mood, soreness, and performance is a reason to adjust.
Use recovery data as a conversation with your training log. What stress did you apply? What changed afterward? Did the easy day stay easy? Did the next key session rebound? That pattern is more useful than any single score.

Our editorial approach & AI disclosure
We use AI to help research, organize, and draft some articles. Every article is reviewed by a human editor and aims to reflect current evidence-based training practices and scientific literature.
Read our editorial policy