

Training Log & Analytics
Balancing Three Sports in One Training Log
A practical triathlon training log system for combining swim, bike, and run workouts without losing sport-specific detail. Learn what to record, how to compare sessions, and how to review the whole week.

Introduction
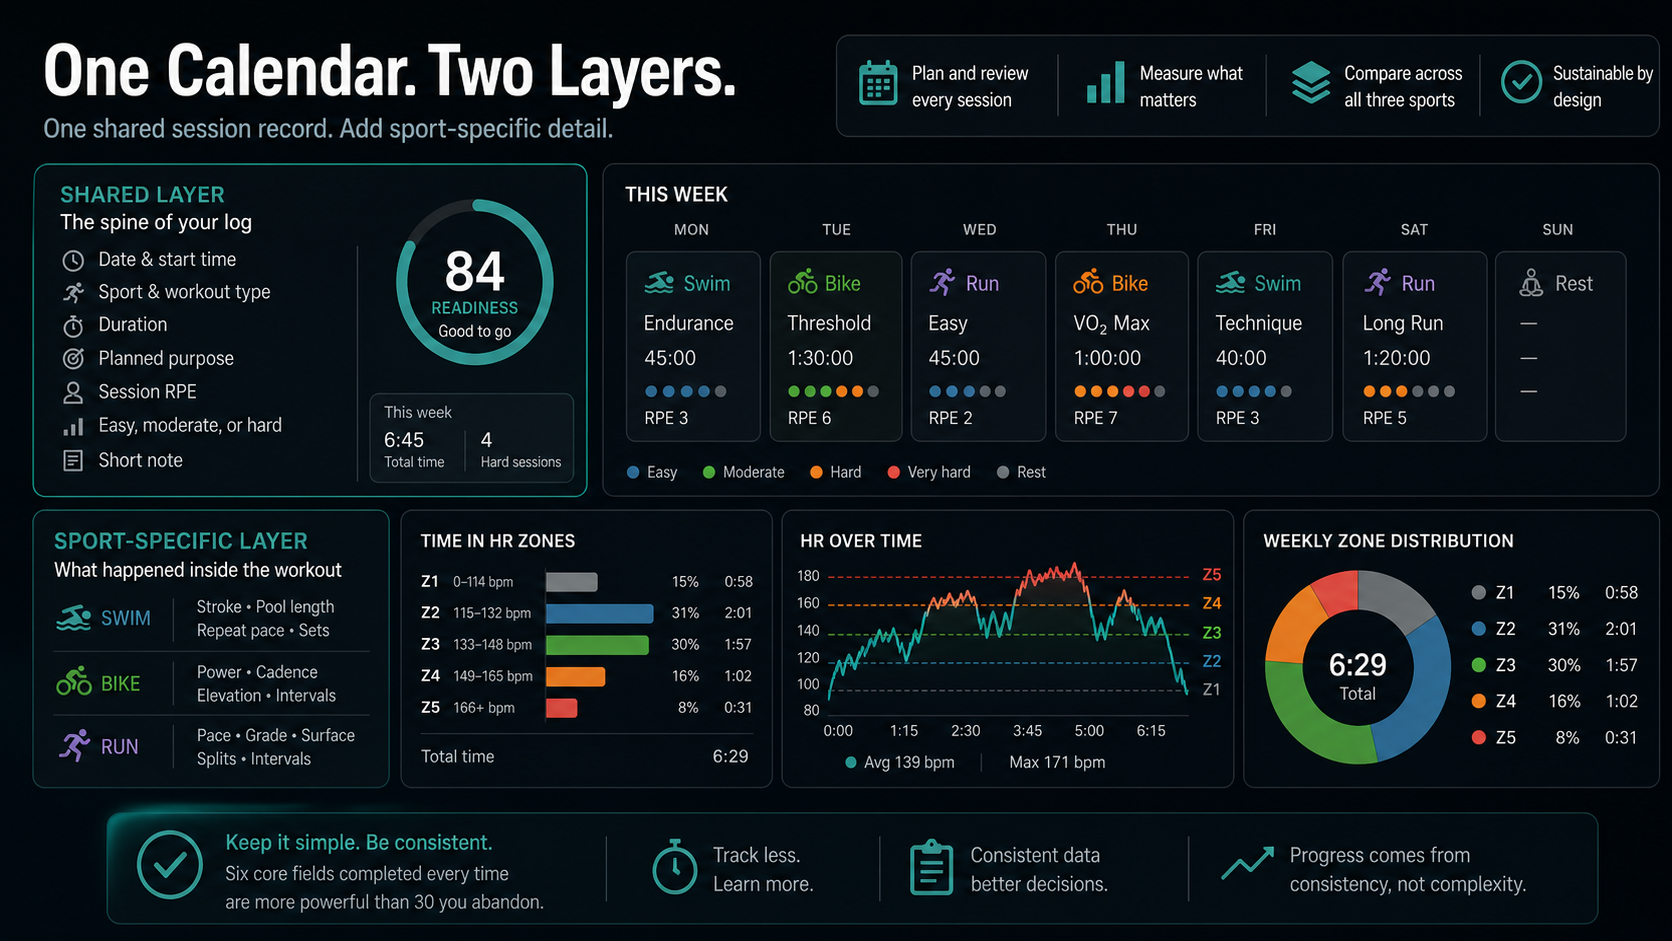
The best way to balance swimming, cycling, and running in one training log is to use one calendar with two layers of information. The first layer is shared by every session: duration, purpose, perceived effort, intensity, and a short note. The second layer stays specific to the sport: swim pace and strokes, bike power and cadence, or run pace and elevation.
That structure solves the central problem of a triathlon training log. You need a single view of the week because fatigue does not stay inside sport labels, but you cannot compare all three sports with one raw metric. Ten kilometers of running is not equivalent to ten kilometers of cycling. An hour in the pool is not interchangeable with an hour on the road. Even heart-rate responses can differ between cycling and running; a review of triathletes found mode-specific differences in maximal and submaximal heart rate as well as other physiological responses (Millet, Vleck, and Bentley). The practical guide to Zone 2 running versus cycling explains how to preserve those sport-specific heart-rate targets inside one weekly view.
A useful log therefore does not force the three sports into false equivalence. It preserves what makes each session meaningful, then adds enough common context to answer practical questions:
- Did the week contain the intended balance of swim, bike, and run?
- Were the key sessions hard for a reason, or did easy sessions drift upward?
- Did one sport create fatigue that changed another?
- Is the next week a sensible progression from this one?
This guide shows exactly what to record, how to organize bricks and double days, which summaries deserve attention, and how to turn a crowded workout history into decisions.
Why Three Sports Make One Log Complicated
Single-sport logs already contain imperfect data. Triathlon adds two more measurement systems and several more ways to misunderstand them.
Swimming is often described by distance, repeat pace, stroke, pool length, rest intervals, and technique quality. Cycling may use duration, distance, speed, elevation, power, cadence, and heart rate. Running tends to emphasize duration, distance, pace, elevation, heart rate, and perceived effort. Open water, indoor trainers, treadmills, hills, heat, wind, and equipment make the same metric mean different things from one session to the next.
The data also describe two different sides of training. External load is the work completed: meters swum, watts produced, kilometers covered, or minutes exercised. Internal load is the athlete's response: heart rate, perceived effort, fatigue, or other psychophysiological strain. The distinction matters because the same external work can create a different internal response when an athlete is tired, hot, under-fueled, or becoming fitter. Researchers who revisited the internal–external load framework emphasized that exercise dose and individual response are related but distinct concepts (Impellizzeri, Marcora, and Coutts).
No single number captures all of that. The purpose of one log is not to discover a perfect universal unit. It is to keep the important signals close enough that you can see relationships across the week.
Use One Calendar but Two Measurement Layers
Build the log around a shared session record, then attach sport-native detail. This gives you a clean weekly view without discarding the metrics needed to understand performance.
| Shared layer for every session | Sport-specific layer |
|---|---|
| Date and start time | Swim: stroke, pool length, repeat pace |
| Sport and workout type | Bike: power, cadence, elevation |
| Duration | Run: pace, grade, surface |
| Planned purpose | Sport-specific zones or thresholds |
| Session RPE | Equipment and environmental context |
| Easy, moderate, or hard classification | Intervals, laps, splits, or set details |
| Short note | Technique or execution observations |
The shared layer is the spine of the training log. It lets you total time, count hard sessions, see how doubles are arranged, and review perceived strain across all three sports. The sport-specific layer explains what actually happened inside each workout.
This approach is consistent with the broader consensus on athlete-load monitoring: useful monitoring normally combines multiple measures chosen for a clear purpose rather than collecting data for its own sake (Bourdon and colleagues). For an age-group triathlete, the system should also be sustainable. Six fields completed consistently are more valuable than 30 fields abandoned after two weeks.
Record These Six Fields After Every Session
If you want a minimum viable triathlon log, record six things.
1. Sport and session type
Choose swim, bike, run, strength, mobility, race, or rest, then add a useful type such as recovery, technique, endurance, tempo, threshold, intervals, long, or brick. The label should describe the session's job, not merely where it happened.
2. Duration
Time is the cleanest common exposure measure. It does not make an hour of running physiologically equal to an hour of swimming, but it lets you see how the limited hours in your week were allocated. Duration also remains useful when distance is missing or distorted by drills, current, elevation, or indoor training.
3. Planned purpose
Write one short sentence before training: “easy aerobic swim with relaxed technique,” “bike threshold intervals,” or “long run for durability.” The plan gives the completed data something to answer. Without purpose, a chart can show that a session was hard but not whether hard was appropriate.
4. Session RPE
Rate the whole session on a consistent scale, commonly 0–10, after you have had a little time to reflect. Session RPE is valuable in a multi-sport log because it works when the main external metric changes. The foundational study found the method useful across different forms of exercise and proposed it as a broadly applicable way to quantify training (Foster and colleagues).
Multiplying duration in minutes by session RPE produces a simple arbitrary-unit load: a 60-minute session rated 4 equals 240 units. Use that score to compare your own recent sessions and weeks, not to claim that two equal scores create identical tissue stress or adaptation.
5. Intensity distribution
Record time in zones when the underlying signal is trustworthy, or use a simpler easy–moderate–hard classification when it is not. Keep zone settings sport-specific where possible. A cycling threshold heart rate should not automatically define running zones, and swim intensity may be better represented by pace, set structure, and effort.
6. One useful note
Write the fact most likely to change interpretation later: poor sleep, hot weather, sore calf, strong final intervals, missed fueling, rough water, unusually low power, or “felt easy despite high heart rate.” A good note explains a number; it does not repeat it.
Keep the Important Metrics Native to Each Sport
A unified log should make the week easier to read, but each sport still needs its own vocabulary.
Swimming: log the set, not just the total
For swimming, total distance and time are only the outer shell. Add pool length, stroke, set structure, repeat pace, rest interval, and technique focus when they matter. A 2,500-meter continuous aerobic swim is a different training stimulus from 2,500 meters of drills and short fast repeats.
Heart rate is often less useful as the primary control signal in the pool. Measurement can be awkward, the response lags during short repetitions, and technique can deteriorate before heart rate looks extreme. A narrative review of swim-load monitoring found that researchers use several internal and external approaches and argued that the choice should match the athlete, training phase, and practical setting (Feijen and colleagues).
For most recreational triathletes, the high-value swim fields are:
- Total swim time and distance
- Main-set structure and repeat pace
- Stroke or drill focus
- Rest interval
- Session RPE
- One technique note
Do not punish a technique session because it covered fewer meters. The question is whether it achieved its purpose.
Cycling: keep output and physiological cost side by side
Cycling produces abundant external data. Power is particularly useful because it responds immediately to changes in output, while heart rate reflects the body's delayed response. Keep duration, power, normalized or weighted power when available, cadence, elevation, and heart rate visible together.
For steady rides, compare similar sessions over time. If the same endurance power requires a higher heart rate and RPE than usual, look for heat, fatigue, dehydration, poor sleep, or sensor error before declaring a fitness change. Heart-rate monitoring is useful but affected by context, and its limitations have been documented for decades (Achten and Jeukendrup).
For intervals, log the target and whether the intervals were completed consistently. An average for the whole ride can hide both excellent work and excessive surging. The session note might be as simple as “fourth interval faded” or “power stable; RPE lower than last week.”
Running: preserve impact and terrain context
Running deserves special attention because a moderate cardiovascular session can still carry meaningful musculoskeletal cost. Record duration, distance, pace, heart rate, elevation, surface, and footwear only to the level that supports a decision. Trail pace should not be compared directly with flat-road pace, and a brick run should not be judged against a fresh run without context.
Keep easy-run notes particularly honest. If “easy” runs repeatedly have moderate RPE or large amounts of time above the intended zone, that is a weekly pattern worth addressing. It could reflect pace, hills, heat, fatigue, inaccurate zones, or an unrealistic plan. The log should prompt investigation, not issue a verdict.
Compare the Sports Without Pretending They Are Equivalent
The safest way to compare swim, bike, and run is to use a dashboard of complementary measures instead of one master score.
Start with four weekly views:
- Time by sport: shows where your training hours went.
- Intensity by sport: shows easy, moderate, and hard time without mixing thresholds.
- Session RPE load: provides one approximate internal-load view across exercise modes.
- Key-session completion: shows whether the workouts most connected to your goal were completed as intended.
These views answer different questions. Time by sport can reveal that cycling crowded out swimming. Intensity distribution can show that the run week became harder than planned. Session RPE can catch a supposedly easy swim that felt unusually costly. Key-session completion prevents a large total volume from hiding missed race-specific work.
Avoid using estimated calories as the common currency. Energy-expenditure estimates from consumer wearables are not dependable enough for that role. A systematic review of commercial devices found heart-rate and step measures more credible in some settings, while no brand was accurate for energy expenditure (Fuller and colleagues). Calories may still be displayed as device output, but they should not decide whether a run and ride were equivalent.
Also resist the temptation to turn one load ratio or color-coded readiness score into an injury forecast. Training-load research contains important conceptual and methodological limitations, and authors have specifically warned against using simple load metrics as causal injury predictors (Impellizzeri and colleagues). Use trends to start a conversation with your body, coach, or clinician—not to diagnose yourself.
Treat Bricks and Double Days as Linked Sessions
A brick should appear as one connected training event with separate bike and run legs. Keep native metrics for each leg, but add a shared brick purpose and a single note about the transition.
For example:
| Brick field | Example |
|---|---|
| Purpose | Practice controlled race-effort bike into easy run |
| Bike | 90 min, mostly endurance power, RPE 4 |
| Transition | 4 min |
| Run | 25 min, easy-to-steady, RPE 5 |
| Combined note | Legs settled after 8 min; run HR higher than fresh easy pace |
The bike can change the physiological and biomechanical cost of the run. A review of the cycle-to-run transition reported altered responses during triathlon running and noted that the way the bike leg is performed can influence the adjustment to running (Millet and Vleck). That is why two separate files with no link lose important meaning.
Handle double days similarly. Keep the morning swim and evening run as distinct sessions, then review their combined daily load and spacing. If the second workout was unexpectedly poor, the first session, the recovery window, work stress, or nutrition may be part of the explanation.
Build a Weekly Dashboard That Answers Decisions
A useful triathlon dashboard is not a wall of graphs. It is a short summary that helps you plan Monday.
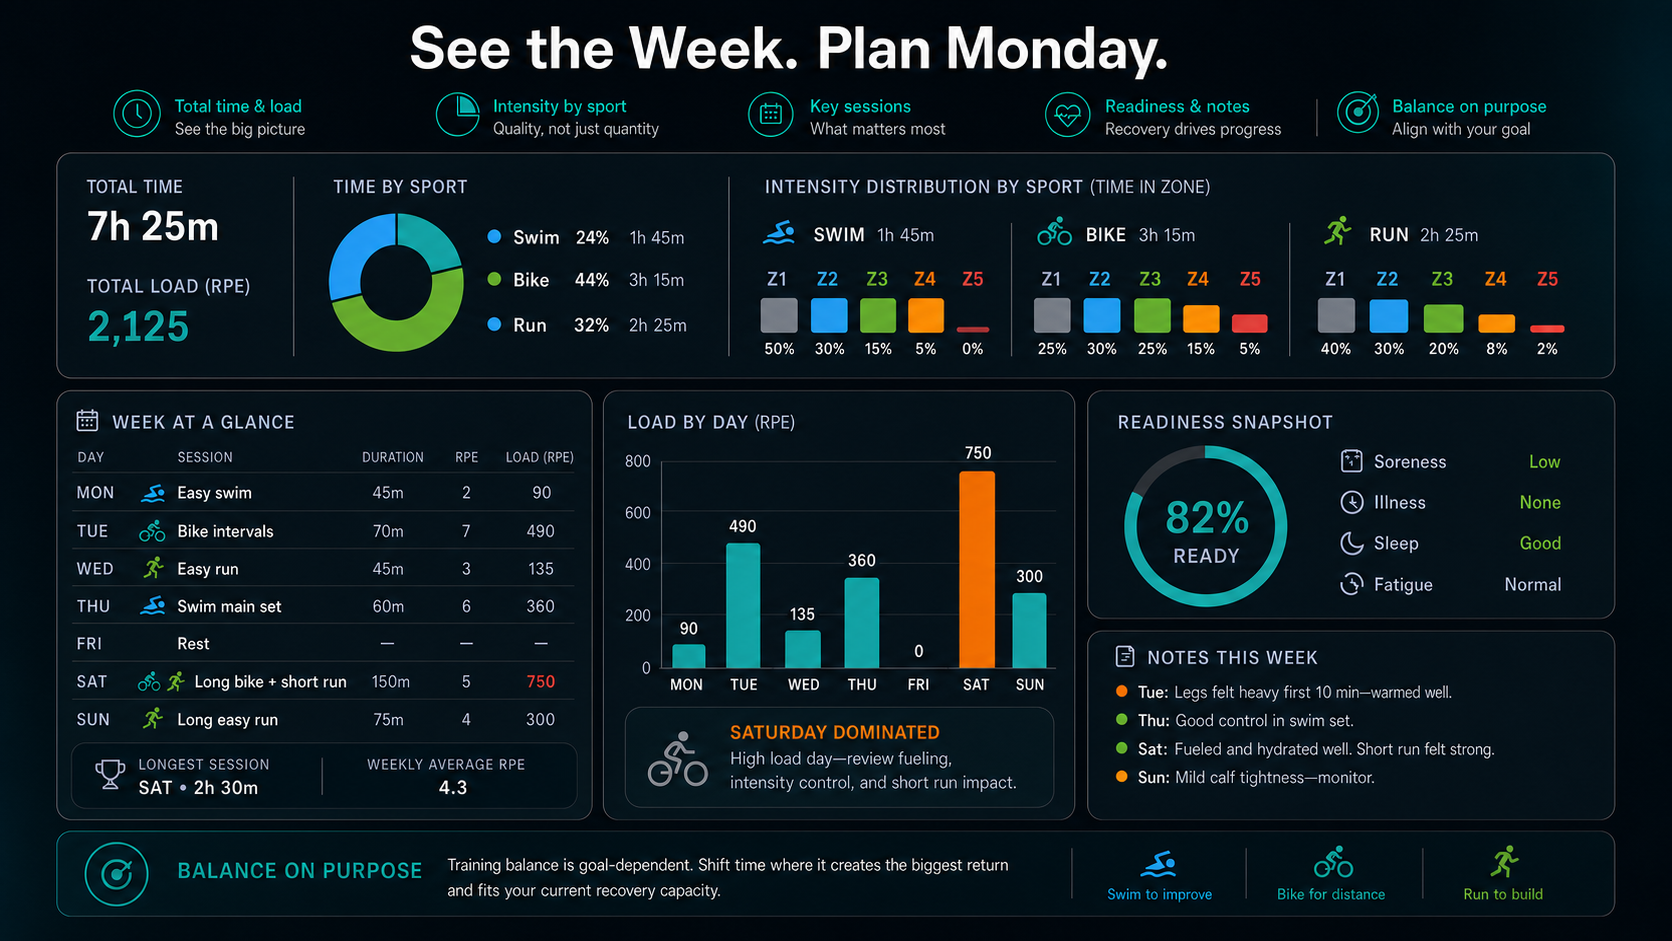
At the top, show total training time and the share assigned to each sport. Under that, show intensity distribution within each sport. Then list the week's key sessions, longest session, total session RPE load, and any notes tagged for soreness, illness, poor sleep, or unusual fatigue.
Consider this illustrative week for an athlete in a general preparation phase:
| Day | Session | Purpose | Duration | RPE | Shared load |
|---|---|---|---|---|---|
| Monday | Easy swim | Technique and recovery | 45 min | 2 | 90 |
| Tuesday | Bike intervals | Threshold development | 70 min | 7 | 490 |
| Wednesday | Easy run | Aerobic durability | 45 min | 3 | 135 |
| Thursday | Swim main set | Controlled threshold | 60 min | 6 | 360 |
| Friday | Rest | Absorb training | — | — | — |
| Saturday | Long bike + short run | Endurance and transition | 150 min | 5 | 750 |
| Sunday | Long easy run | Durability | 75 min | 4 | 300 |
The load column is duration multiplied by RPE. It is useful for seeing that Saturday dominated the week, but it is not the full story. The Saturday score does not reveal how much impact came from the short run, whether the bike power was controlled, or whether the athlete fueled well. Those details live in the sport layer and notes.
The dashboard should make imbalance visible without insisting on equal thirds. Training balance is goal-dependent. A weak swimmer may intentionally swim more frequently. A long-course athlete may spend more total time cycling. A runner returning from injury may temporarily shift aerobic volume to the pool and bike. “Balanced” means aligned with the current goal and recovery capacity, not divided into three identical slices.
Review the Week in Three Passes
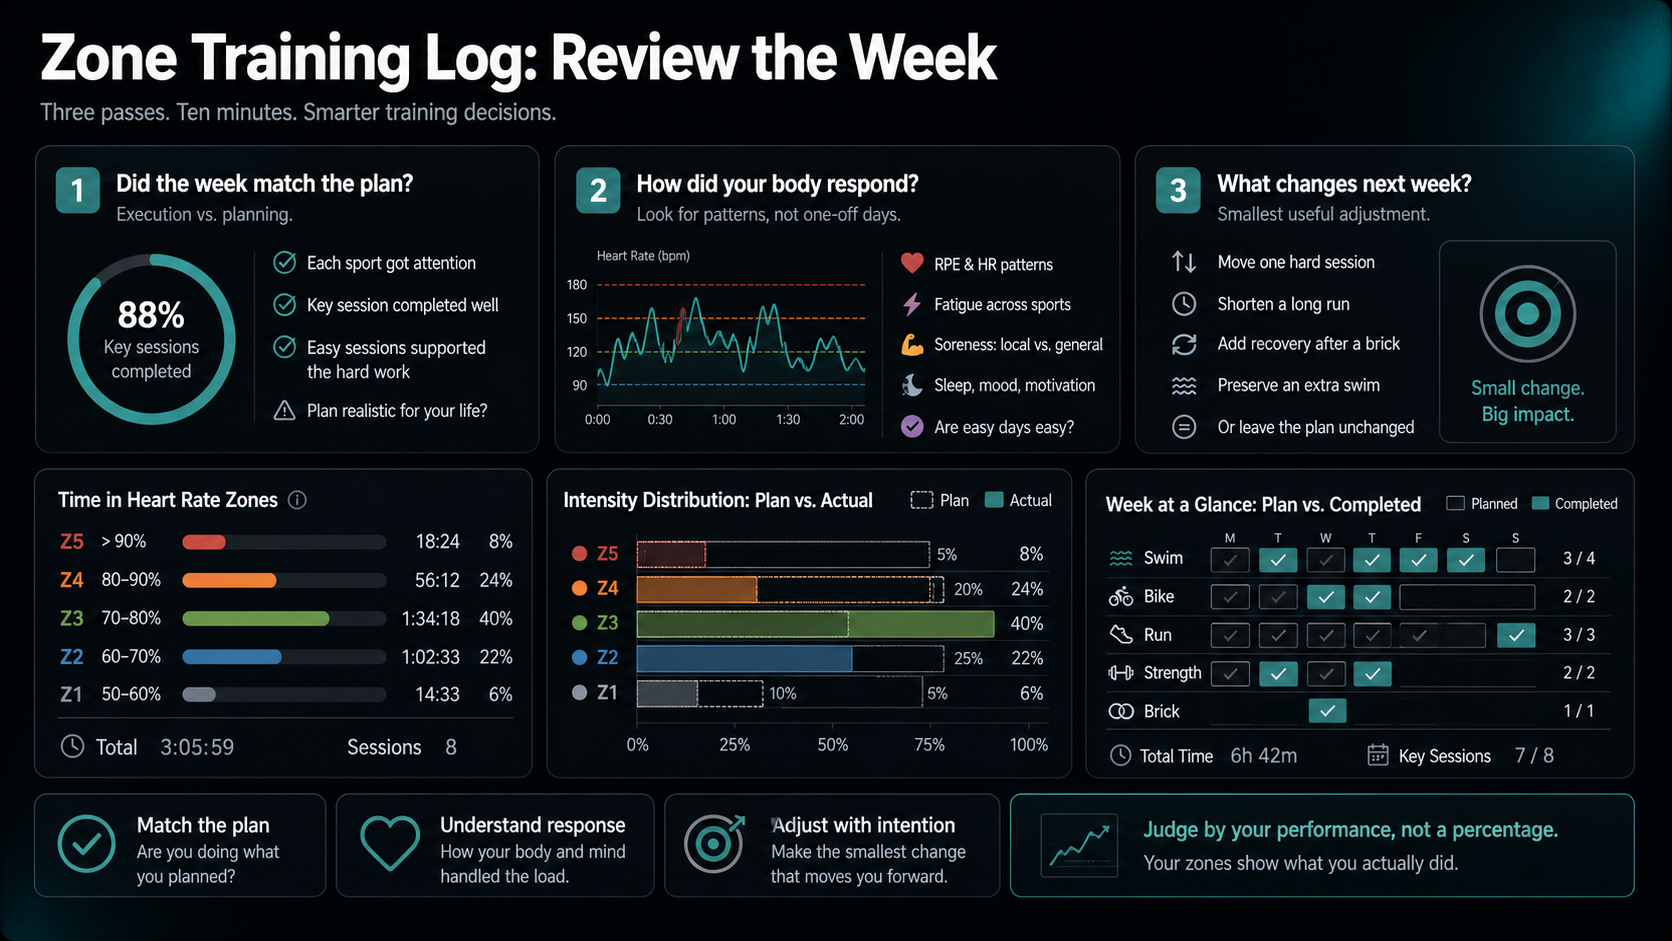
Set aside ten minutes at the end of the week and review the log from broad to specific.
Pass 1: Did the week match the plan?
Compare planned and completed sessions. Look at frequency, duration, and key-session completion by sport. Separate an execution problem from a planning problem. Missing a swim because the pool closed is different from repeatedly skipping swims because the weekly schedule is unrealistic.
Ask:
- Did each sport receive the intended attention?
- Which key session mattered most, and was it completed well?
- Did easy sessions support the hard work?
- Did life stress make the plan unrealistic?
Pass 2: How did your body respond?
Scan session RPE, heart-rate patterns, notes, soreness, sleep, mood, and motivation. Look for clusters, not isolated bad days. A junior-elite triathlon camp study found that session RPE and mood measures captured substantial changes in fatigue during intensified training, illustrating why subjective responses deserve a place beside workout files (Comotto and colleagues). The study population and camp setting do not make its results a prescription for every age-group athlete, but the monitoring lesson transfers well.
Ask:
- Which session felt harder than its external metrics suggested?
- Did fatigue carry from one sport into another?
- Is soreness local and sport-specific, or is general fatigue rising?
- Are easy sessions still feeling easy?
Pass 3: What changes next week?
Make the smallest useful adjustment. You may move one hard session, shorten a long run, add recovery after a brick, preserve an extra swim frequency, or leave the plan unchanged. Do not rewrite the entire program because of one noisy workout.
Training-intensity research supports accumulating substantial low-intensity work, but it does not establish one universally superior distribution for every athlete. A 2024 meta-analysis found some advantages of polarized training for aerobic power while finding similar effects across several other performance outcomes, with results influenced by training level and intervention duration (Oliveira, Boppre, and Fonseca). Your log should therefore show the distribution you actually performed and help you judge it against your plan, rather than grading every week against a rigid internet percentage.
Make Missing and Noisy Data Visible
Triathlon files are messy. Watches miss pool lengths, optical heart rate drops out, indoor rides lack distance, GPS pace jumps under trees, and an open-water session may have no useful heart-rate trace. Hiding those gaps creates false confidence.
Mark questionable fields rather than silently treating them as accurate. If heart rate is missing, keep duration, RPE, purpose, and sport-specific execution notes. If swim distance is obviously wrong, correct it only when you know the set total and leave a note. If two devices recorded the same brick, merge or link the records so the week is not double-counted.
Device accuracy can vary by sport and protocol. A 2024 study testing ten smartwatches for triathlon training found wide variation across heart rate, distance, and swim measures, with particularly large errors in some mixed-stroke swim tests (Jacko and colleagues). The practical rule is not to distrust every wearable. It is to treat implausible data as uncertain and keep a manual context layer that survives sensor failure.
Consistency matters more than artificial precision. Use the same RPE scale, similar workout labels, stable zone definitions, and repeatable notes. When you change a threshold or zone model, record the date. Otherwise, an apparent change in time in zone may be a settings change rather than a training change.
Common Multi-Sport Logging Mistakes
Comparing raw distance across sports
Distance is useful within a sport and nearly meaningless across sports. Use time to describe allocation, then review native performance metrics separately.
Using one heart-rate zone profile everywhere
Cycling and running responses can differ, while swimming has additional measurement challenges. Use sport-specific thresholds and zones when possible. If your platform cannot, label the limitation and lean more heavily on RPE, pace, power, and set structure.
Logging only completed workouts
A calendar of achievements cannot explain why training changed. Include planned purpose, skipped sessions, rest days, and brief reasons. The gap between planned and completed training often contains the most useful scheduling lesson.
Turning every metric into a target
More distance, more load, more elevation, and more high-zone time are not automatically better. Metrics describe the work. The training goal determines whether the work was appropriate.
Reviewing each sport in isolation
A hard ride can weaken the next run. A demanding run can compromise later sessions through impact-related fatigue. A swim can be restorative or surprisingly costly depending on intensity and technique. Always finish a sport-level review with a whole-week review.
Confusing a clean dashboard with certainty
Colors and scores can make estimates look objective. Keep uncertainty visible. The International Olympic Committee's load consensus encourages monitoring training, competition, psychological load, and well-being, but load management remains a process of interpretation rather than a guaranteed injury-prevention formula (Soligard and colleagues). Pain that persists, worsens, changes mechanics, or concerns you belongs with a qualified health professional—not inside a spreadsheet experiment.
How Zone Training Log Fits the Workflow
Zone Training Log can serve as the shared interpretation layer when your workouts come from Apple Health or Health Connect. It organizes workout type, duration, heart rate, zone metrics, distance, pace, elevation, effort, tags, and notes in one timeline, while keeping the original sport attached to each session.
For a triathlete, the practical workflow is:
- Record each swim, ride, and run with the most appropriate device or app.
- Import the sessions into one chronological log.
- Check sport type, duration, heart-rate data, and duplicates.
- Add a clear title, purpose tag, effort rating, and one useful note.
- Review individual sport patterns before looking at the combined week.
- Use daily, weekly, monthly, or custom-range summaries to identify trends.
The product should not replace judgment. Its value is reducing the clerical work between data collection and reflection. When every sport appears on the same timeline, it becomes easier to see that Tuesday's hard bike preceded Wednesday's poor run, that swim frequency disappeared during a busy month, or that an apparently large training week was mostly controlled cycling rather than high-impact running.
If you already have months of inconsistent history, do not wait to clean everything. Start with the current week. Add the six shared fields consistently, preserve the most useful native data, and build a review habit from now forward.
Conclusion
Balancing three sports in one training log does not require reducing swimming, cycling, and running to one magic score. Use one calendar and two measurement layers: shared context for the whole week, sport-specific detail for each workout.
Record sport, duration, purpose, session RPE, intensity, and one useful note every time. Keep swim sets, bike power, and run pace in their proper contexts. Link bricks, review double days together, make missing data visible, and compare weeks with a small dashboard rather than a single verdict.
The result is more than an archive. It is a feedback loop: plan the week, record what happened, understand how your body responded, and make one sensible adjustment. That is what turns three separate sports into one coherent training process.
Our editorial approach & AI disclosure
We use AI to help research, organize, and draft some articles. Every article is reviewed by a human editor and aims to reflect current evidence-based training practices and scientific literature.
Read our editorial policy