

Training Log & Analytics
How Do You Analyze Heart Rate Zones After a Workout?
Learn how to review heart rate zones after a workout by comparing time in zone with workout intent, pace, power, perceived effort, drift, recovery, and sensor accuracy.

Introduction
To analyze heart rate zones after a workout, start by comparing the zone chart with the workout's purpose. Then check whether the heart-rate pattern agrees with pace, power, terrain, perceived effort, weather, and recovery. The useful question is not just "What zone was I in?" It is "Did this workout create the training stress I intended, and what should I do next?" If the boundaries themselves are unfamiliar, begin with what heart rate zone training means.
A heart-rate-zone chart can answer that question well, but only when you read it in context. Heart rate is an internal load measure: it shows how your body responded to the workout, not only how fast you ran, how many watts you rode, or how steep the route was. Training-load researchers make this distinction between internal load, such as heart rate and perceived effort, and external load, such as distance, speed, power, or elevation (Bourdon et al., International Journal of Sports Physiology and Performance).
That distinction is why post-workout analysis is so valuable. Two workouts can have the same pace and distance but very different zone profiles. One may be a smooth easy aerobic session. The other may be a stressful run in heat, poor sleep, or fatigue that quietly turned into moderate intensity. The zone chart helps you see the difference.
The best review is simple and repeatable. Look at the goal of the session, check time in zone, inspect the shape of the heart-rate curve, compare it with effort and external output, note any likely reasons for mismatch, and choose one adjustment. That turns heart-rate data into training decisions instead of data noise.
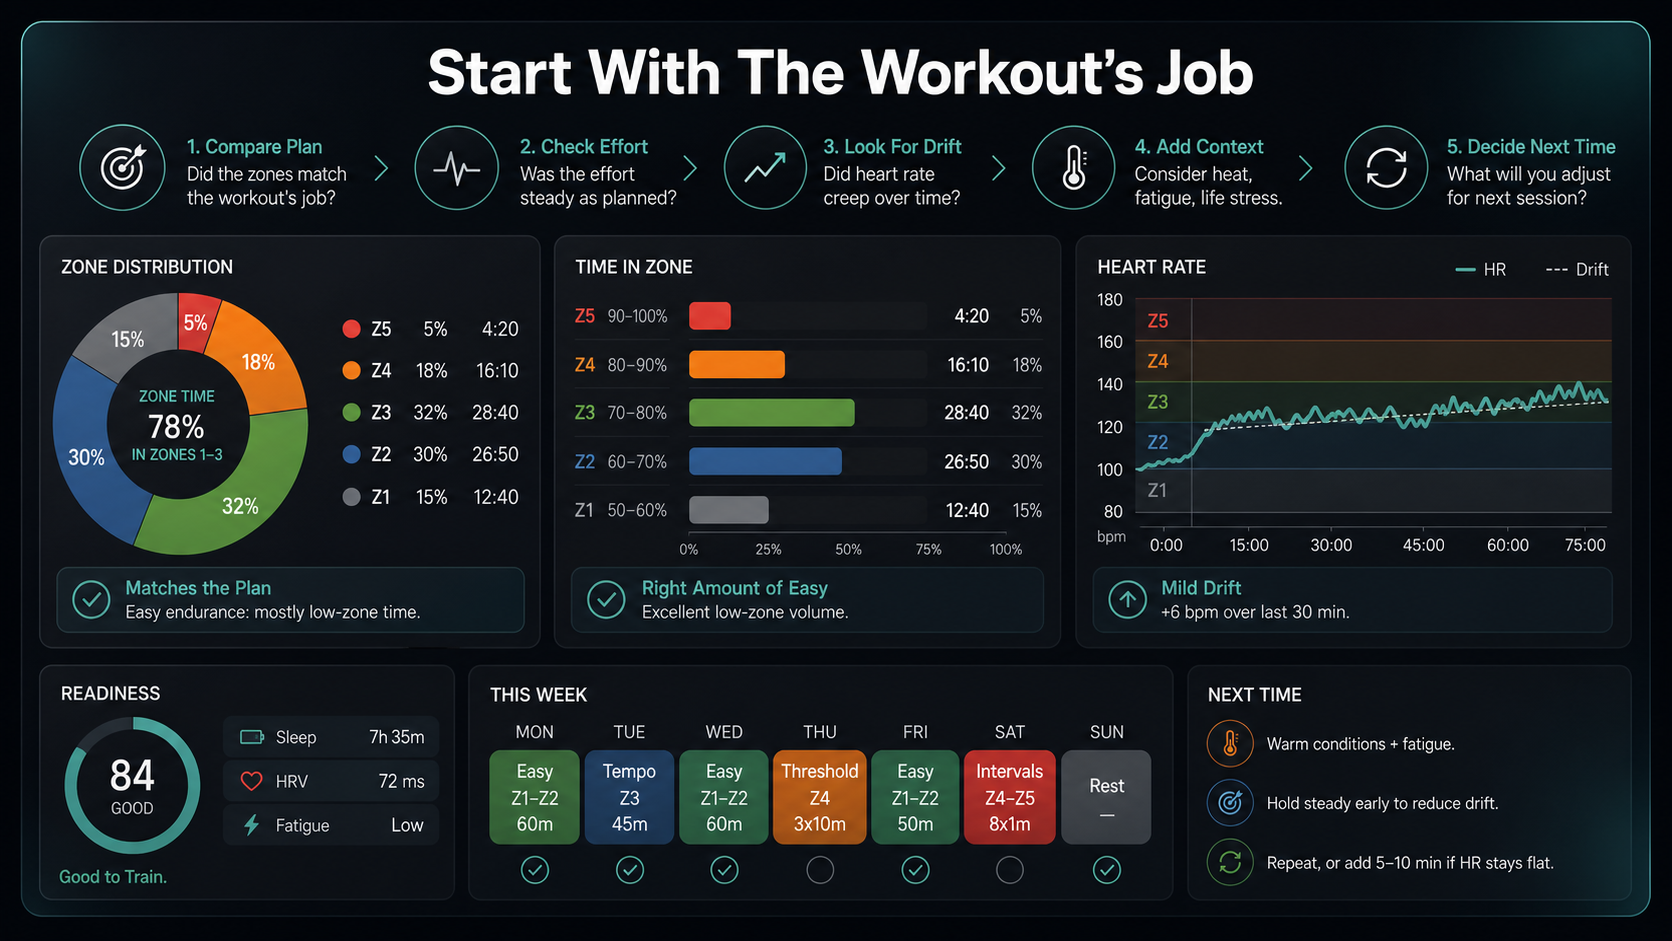
Start With The Workout's Job
Before you judge whether a heart-rate-zone chart was good or bad, ask what the workout was supposed to do. An easy endurance workout should usually show mostly low-zone time. A threshold workout should include controlled time near your upper sustainable range. A recovery day should stay genuinely easy. Short intervals may not show much Zone 5 even when the muscular effort was hard because heart rate rises with a delay.
This is the most common mistake in post-workout analysis: treating the same zone distribution as good or bad for every workout. A session with 40 minutes in Zone 2 can be excellent if the goal was aerobic endurance. It can be undercooked if the goal was threshold work. It can be too hard if the plan was true recovery.
Use a simple intent check:
| Workout type | A zone chart that usually fits | A chart worth questioning |
|---|---|---|
| Recovery workout | Mostly Zone 1, maybe low Zone 2 | Long Zone 3 blocks |
| Easy endurance | Mostly Zone 1-2 | More moderate time than planned |
| Long aerobic workout | Mostly low zones, possible mild late drift | Hard zones early or large unexplained drift |
| Tempo or threshold | Controlled Zone 3-4 depending on your system | Too easy to stimulate the target, or too hard to repeat |
| Short intervals | Heart rate may lag behind effort | Judging the whole workout only by Zone 5 time |
This is also where zone systems can confuse people. One app's Zone 3 might be another coach's tempo zone. Some systems use percentages of maximum heart rate. Others use heart-rate reserve, lactate threshold heart rate, or ventilatory thresholds. Achten and Jeukendrup's review of heart-rate monitoring describes heart rate as useful for exercise prescription and monitoring, but also notes that interpretation depends on conditions, individual physiology, and the monitoring method (Sports Medicine).
So the first review step is not mathematical. It is practical: name the intended training stimulus. Easy? Endurance? Tempo? Threshold? Intervals? Recovery? Without that anchor, the chart is just color.
Make Sure Your Zones Are Worth Interpreting
Post-workout analysis only works if the zone boundaries are close enough to your physiology. If your zones are wrong, you can draw the wrong conclusion from accurate heart-rate data.
The most common weak point is maximum heart rate. Many consumer devices and apps use age-based formulas unless you manually enter tested values. Population formulas can be useful starting points, but they are not precise for every individual. Tanaka, Monahan, and Seals revisited age-predicted maximum heart rate and proposed the often-cited 208 minus 0.7 times age equation, but the key lesson for training analysis is that age prediction is still an estimate, not a personal test result (Journal of the American College of Cardiology01054-8)).
If your estimated maximum heart rate is too low, ordinary easy efforts may appear as Zone 3. If it is too high, hard workouts may look easier than they were. In both cases, the post-workout chart can be misleading even if the watch or chest strap measured your pulse correctly.
Threshold-based zones can be better for trained endurance athletes, but they also need maintenance. If your lactate-threshold heart rate, critical power, or field-test result is old, the zones may no longer match your current fitness. Fitness gains, detraining, medications, altitude exposure, illness, and changes in sport can all shift how heart rate relates to output.
Before you analyze patterns too deeply, ask whether your zones come from a real test, a recent field estimate, or a default formula. Then check whether they are specific to the sport you just trained and whether they still agree with breathing and perceived effort during familiar workouts.
The last question matters because heart-rate zones should not override obvious physiology. The CDC's talk-test guidance is simple but useful: at moderate intensity, you can talk but not sing; at vigorous intensity, speaking more than a few words becomes difficult (CDC). If your device says Zone 2 while you are breathing hard and cannot speak comfortably, the number deserves skepticism. If it says Zone 4 while you feel relaxed and conversational, check the sensor and zone setup.
Read Time In Zone, But Do Not Worship It
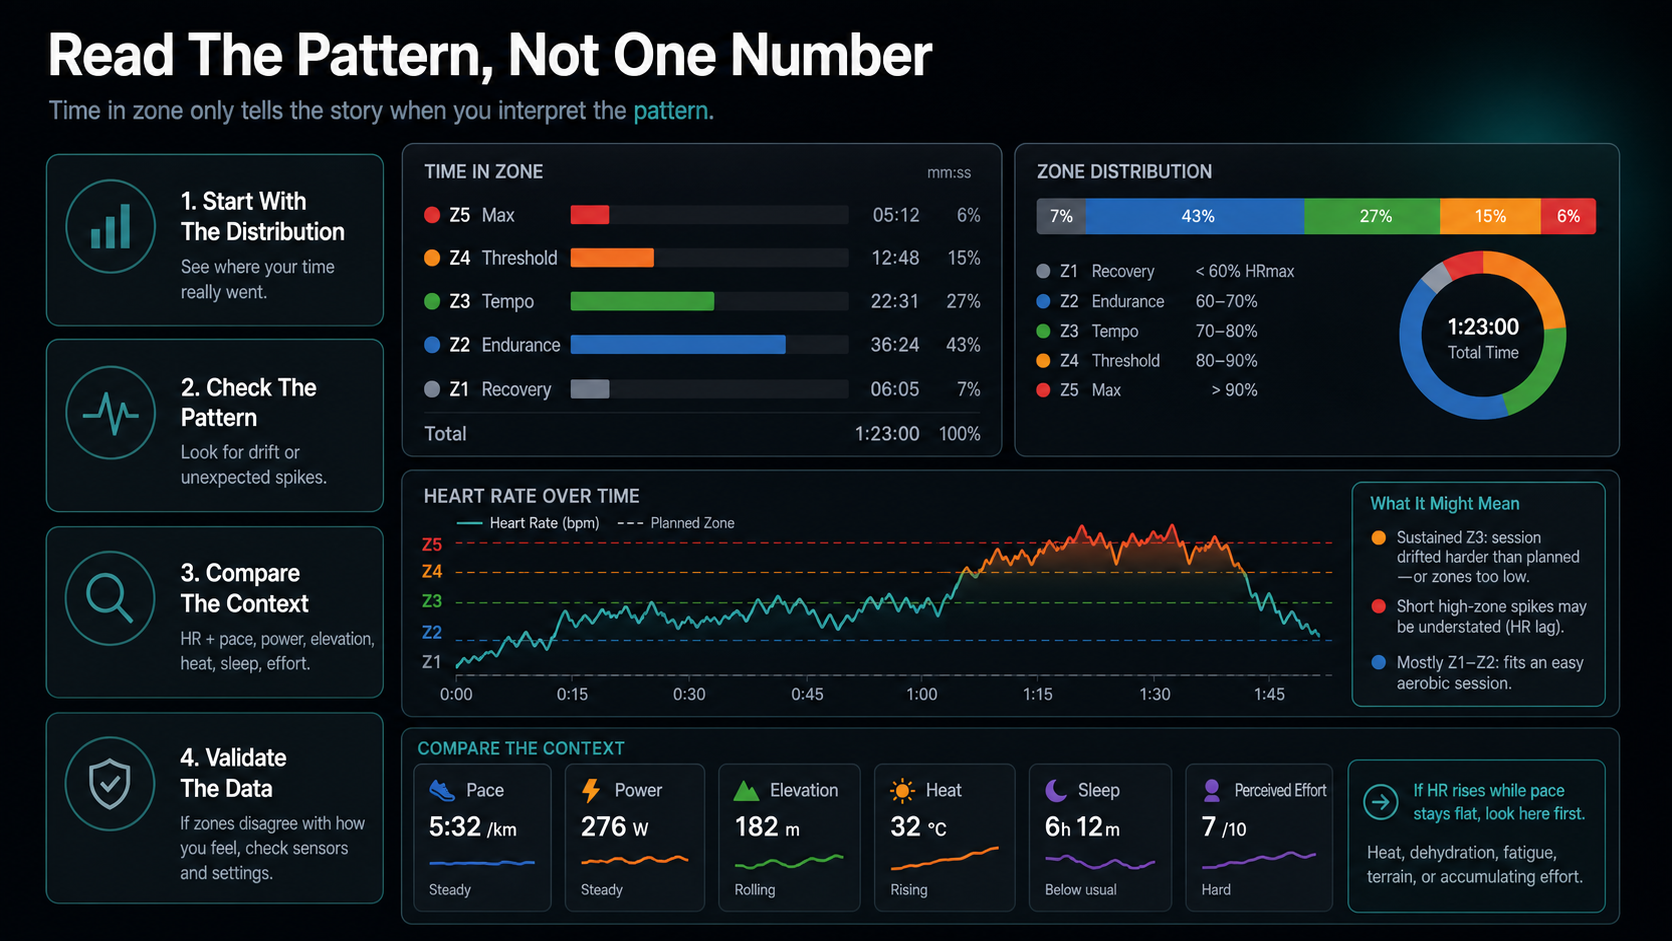
Time in zone is the first number most athletes look at after a workout. It is useful because it summarizes the distribution of intensity. It can show whether an easy workout stayed easy, whether a threshold workout included enough target time, or whether a long session accumulated more moderate stress than expected.
But time in zone is a summary, not a verdict. It hides sequence, terrain, warmup, cooldown, pauses, and heart-rate lag. Ten minutes in Zone 4 can mean a well-executed tempo finish, an accidental hill surge, or noisy wrist data. The number matters, but the story around it matters more.
Start with totals, then percentages. Total minutes help you understand the actual dose. Percentages help you compare workouts of different lengths. For example, 12 minutes in Zone 3 is different in a 30-minute recovery run than in a 2-hour long run. The percentage can flag that difference quickly.
Next, separate planned from unplanned time. If you planned an easy 50-minute run and spent 42 minutes in Zone 1-2 with 8 minutes in Zone 3 on hills, that may be fine. If you spent 28 minutes in Zone 3 on flat terrain while trying to stay easy, that is different. The same color means different things depending on where and why it happened.
Then decide whether warmup and cooldown should count. For many workouts, they should be visible but interpreted separately. A threshold session might show only 25 percent in the target zone because the warmup, recoveries, and cooldown make up most of the file. That does not mean the workout failed. It means the zone chart includes the whole session.
The research on intensity distribution also warns against oversimplifying. Seiler and Kjerland studied well-trained junior cross-country skiers and compared intensity distribution using heart rate, session rating of perceived exertion, and blood lactate. Their data showed broadly similar distribution patterns across methods, with most endurance training below the first ventilatory threshold and a smaller portion at high intensity (Scandinavian Journal of Medicine & Science in Sports). That supports using zones as a practical lens, but it does not mean one workout's pie chart should drive every training decision.
Use time in zone to ask better questions: did the distribution match the session intent, was the hard time planned, did the easy time stay genuinely easy, and did warmup, cooldown, or recoveries distort the summary? If the answer is clear, act on it. If it is ambiguous, check the shape of the workout before changing your training.
Compare Heart Rate With Pace, Power, Elevation, And RPE
Heart rate is most useful after a workout when you compare it with other signals. A high heart rate with high pace or power may simply mean you trained hard. A high heart rate with ordinary pace may mean heat, dehydration, fatigue, poor sleep, illness, caffeine, stress, or accumulated training load. A low heart rate with high perceived effort can also be a warning sign, especially if it appears with fatigue or heavy legs.
This is the difference between internal and external load. Internal load tells you how hard the workout was on your body. External load tells you what work you performed. Training-load monitoring is strongest when you interpret both together, a point emphasized in the athlete-load consensus statement by Bourdon and colleagues (International Journal of Sports Physiology and Performance).
For running, compare heart-rate zones with pace, grade-adjusted pace if available, elevation gain, surface, wind, temperature, and perceived effort. For cycling, compare zones with power, cadence, terrain, wind, and position. For hiking or trail running, heart rate may be more informative than pace because terrain changes so much, but elevation and footing still matter.
Perceived effort, often called RPE, is not a soft metric. It is a compact summary of how the session felt. If heart rate and RPE agree, your confidence goes up. If they disagree, investigate.
Here are common combinations:
| Heart rate | External output | RPE | Likely interpretation |
|---|---|---|---|
| Higher than usual | Same pace or watts | Higher | Heat, fatigue, stress, illness, or dehydration |
| Higher than usual | Faster pace or watts | Higher | Probably a harder session |
| Lower than usual | Same output | Same or lower | Fitness improvement, cooler conditions, or better recovery |
| Lower than usual | Same output | Higher | Fatigue, under-recovery, fueling issue, or sensor problem |
| Jumpy or implausible | Output steady | Effort steady | Sensor noise or poor contact |
Do not force every workout into one cause. Look for the most plausible explanation from the context. A hot, hilly, windy, sleep-deprived long run does not need a complicated interpretation. The zone chart is probably showing that the session cost more than the pace suggested.
Look For Heart Rate Drift
Heart rate drift is one of the most useful post-workout patterns for endurance athletes. It happens when heart rate rises over time even though pace or power stays similar. In a steady aerobic workout, mild drift can be normal. Large drift may suggest that the effort was too hard, the conditions were demanding, fueling or hydration was insufficient, or fatigue accumulated.
Cardiovascular drift has been studied for decades. Coyle and Gonzalez-Alonso describe it during prolonged exercise as a pattern involving higher heart rate and lower stroke volume, especially in heat or dehydration contexts (Exercise and Sport Sciences Reviews). For training analysis, the practical takeaway is simple: heart rate can climb even when your external output does not.
To review drift, avoid judging the first few minutes. Warmups are noisy because heart rate is still rising and your device may be settling. Instead, compare the middle and later parts of a steady section. If pace or power is flat but heart rate climbs steadily, the workout became more internally costly.
Ask:
- Did heart rate rise at the same pace or power?
- Did the rise happen gradually, or only after hills or surges?
- Was the workout hot, humid, windy, or dehydrating?
- Did you fuel and drink enough for the duration?
- Was this workout placed after hard training or poor sleep?
For easy aerobic sessions, drift can help you decide whether the pace was truly easy. If you wanted a Zone 2 run but heart rate climbed into Zone 3 during the second half while pace stayed constant, you may need to start easier, choose flatter terrain, shorten the run, improve cooling or hydration, or adjust zones if they are clearly too low.
For long workouts, drift is not automatically failure. A long run or ride may show some late climb because the session itself creates fatigue. The issue is whether the drift matches the plan. A controlled long aerobic day with mild late Zone 2 drift can be productive. A supposed recovery run that drifts into sustained Zone 3 is probably not recovery.
Interpret Intervals Differently
Heart-rate zones are less direct during short high-intensity intervals. Heart rate responds more slowly than pace, power, and muscular effort. During a 30-second hill repeat, your legs and breathing may be near maximal before heart rate reaches the highest zone. Then heart rate may continue rising during the recovery. If you judge only by time in Zone 5, you may conclude the workout was too easy when it was not.
This is why post-workout analysis should match the workout type. For short intervals, use heart rate to understand the overall load and recovery pattern, not to score every repetition. Pace, power, incline, repetition duration, and RPE often describe the work intervals better.
For longer intervals, such as 3 to 10 minutes, heart rate becomes more useful because it has time to stabilize. You can look for whether each rep reached a similar zone, whether heart rate climbed too much across reps, and whether recoveries were long enough for the goal.
Three interval patterns are worth noticing:
- Heart rate never reaches high zones, but pace or power is strong: normal for short intervals, especially if recoveries are long.
- Heart rate climbs higher each rep at the same output: fatigue, heat, dehydration, or insufficient recovery may be accumulating.
- Heart rate is unusually high from the first rep: warmup, stress, sleep, illness, caffeine, or zones may need review.
For threshold intervals, the best file often looks controlled rather than dramatic. You want enough time near the intended zone without turning the workout into a race. If every threshold session ends with max-zone time and a collapse in pace, the workout may be too hard for repeatable training.
Check Recovery Without Turning It Into A Diagnosis
Heart rate after the workout can also be useful, but it should be interpreted carefully. A quick drop after exercise often suggests good parasympathetic reactivation and recovery response. A slow drop can appear after hard workouts, heat, dehydration, fatigue, or poor conditioning. It can also reflect medical issues, so it should not be treated casually if symptoms are present.
Cole and colleagues found that heart-rate recovery immediately after exercise was associated with mortality risk in a clinical exercise-testing population (New England Journal of Medicine). That does not mean your watch's one-minute recovery number is a diagnosis. It means recovery heart rate is a real physiological signal, and persistent unusual patterns deserve attention.
For everyday training, compare recovery to your own baseline. After similar workouts in similar conditions, does heart rate come down normally? Do you feel composed after the cooldown? Is your next-morning resting heart rate unusually high? Did sleep quality, soreness, mood, or motivation change?
Ask whether you cooled down long enough, whether the session was hot or under-fueled, and whether the pattern is repeating across several workouts. If symptoms such as chest pain, faintness, unusual shortness of breath, or palpitations are present, stop training and seek appropriate medical care. For normal training review, recovery data is most useful as a trend. One weird file is not a conclusion. Several similar files are a pattern.
Common Zone Patterns And What They May Mean
Most post-workout zone questions fall into a few patterns. The goal is not to label every pattern with certainty. The goal is to narrow the likely causes and choose a reasonable next step.
Your Easy Workout Became Zone 3
If an easy workout spends a lot of time in Zone 3, first check the route and conditions. Hills, heat, wind, trail surfaces, and fatigue can all push heart rate up. Then check effort. Could you talk comfortably? Did breathing feel controlled? The CDC talk-test framework can help you cross-check whether the effort was truly moderate or more vigorous (CDC).
If the workout felt easy but the chart says Zone 3 every time, review your zone settings. Your maximum heart rate or threshold may be underestimated. If the workout felt moderately hard, the chart may be right: your easy pace is too fast for the intended day.
The next action is usually simple: slow down earlier, choose flatter terrain, use run-walk if needed, or set a heart-rate cap for easy days. If the mismatch persists across many easy workouts, retest or manually adjust zones.
Your Hard Workout Shows Little High-Zone Time
This is common in short intervals. Heart rate may not climb quickly enough to reflect the work. Look at interval pace, power, grade, repetition quality, and RPE before deciding the session failed. If the reps were short and intense, low Zone 5 time may be normal.
For longer hard workouts, low high-zone time can mean the effort was too conservative, the zones are set too high, or fatigue limited your ability to raise heart rate. Compare the file with perceived effort. If it felt easy and output was low, you may have under-shot the target. If it felt very hard but heart rate stayed low, consider fatigue, illness, fueling, or sensor issues.
Heart Rate Was High For The Same Pace
This pattern is one of the most useful warning signs. If your familiar route at familiar pace produces higher heart rate than usual, ask about heat, humidity, sleep, stress, caffeine, dehydration, illness, and recent training load. It may not mean you lost fitness. It may mean the session was more costly.
Do not overreact to one workout. If the pattern repeats for several days, reduce intensity, add recovery, or shorten the next easy session. If it appears with symptoms or unusual distress, treat it as a health signal rather than a training puzzle.
Heart Rate Was Low But The Workout Felt Hard
This mismatch can happen when you are under-recovered, depleted, cold, using a poor sensor reading, or doing muscularly demanding work that does not drive heart rate as expected. Some athletes also see suppressed heart rate during heavy fatigue.
The key is not to push harder just because the zone is low. If RPE is high and output is poor, the workout is already costly. Log it honestly and make the next session easier.
The File Has Spikes Or Dropouts
Sudden spikes to max heart rate or drops to implausibly low values often point to measurement noise. Wrist optical monitors can struggle with fit, motion, cold skin, tattoos, and irregular movement. In a Stanford-led validation study of wrist devices, Shcherbina and colleagues found that heart-rate measurement was generally more accurate than energy-expenditure estimates, but error still varied by device, activity, and participant characteristics (Journal of Personalized Medicine). A JAMA Cardiology study also found that wrist-monitor accuracy varied across devices and exercise conditions (JAMA Cardiology).
If the chart looks impossible, fix measurement before changing training. Tighten the watch slightly during the workout, clean the sensor, wear it higher on the wrist, warm up in cold conditions, or use a chest strap for sessions where precision matters.
Turn The Analysis Into One Training Decision
A good post-workout review ends with one decision. Without that step, analysis becomes scrolling.
Do not try to adjust everything after one workout. Choose the most likely training implication:
- The workout matched the plan: keep the next session as scheduled.
- It was too hard for an easy day: make the next easy session easier or shorter.
- It drifted late: start slower, improve fueling or hydration, or reduce duration next time.
- The hard work was under-target: adjust pace, power, interval duration, or recovery.
- The data was unreliable: fix sensor setup or use a better monitor.
- The zones seem wrong: retest or update zone settings.
- Recovery looks poor: reduce the next high-intensity session or add rest.
This decision should be proportional to the evidence. One odd workout may deserve a note. A repeating pattern deserves a plan change. For example, one easy run with 12 minutes of Zone 3 on a hot day is probably just context. Four easy runs in a row with 40 percent Zone 3, rising RPE, and poor sleep is a training-load signal.
Zone Training Log, or any training log that stores zone time alongside subjective notes, is useful because it preserves the context you will forget later. The zone chart tells you what happened. The notes explain why it may have happened.
A Ten-Minute Post-Workout Review Workflow
You do not need a long analysis after every session. Use a short workflow for normal training days and a deeper review for key workouts.
- Name the goal: recovery, easy endurance, long aerobic, tempo, threshold, VO2 max, hills, race simulation, or test.
- Check the zone distribution: look at total time and percentage in each zone, then ask whether it fits the goal.
- Inspect the timeline: find whether the zone time happened during warmup, hills, intervals, late drift, or cooldown.
- Compare with output: use pace and elevation for running, power for cycling, and grade or surface for trails.
- Add perceived effort: record RPE, breathing, muscle fatigue, and mood.
- Add context: note heat, humidity, sleep, stress, caffeine, illness signs, fueling, hydration, and soreness.
- Choose the next action: keep the plan, make the next easy day easier, retest zones, change the route, use a chest strap, improve fueling, or recover.
This workflow takes less than 10 minutes. The value compounds when you repeat it over weeks.
How To Review The Week, Not Just One Workout
Individual workouts are noisy. Weekly patterns are more meaningful. After several workouts, look at total time in each zone, not just the most recent file.
Ask whether the week matches your training phase. Base training usually needs plenty of low-intensity volume. A threshold-focused block may include more controlled moderate-hard time. A recovery week should show lower total load and less high-intensity time. Race-specific blocks may intentionally include more intensity, but they still need enough easy work to absorb it.
Seiler and Kjerland's work on endurance athletes is often discussed because it shows how much training can sit below the first threshold in well-trained athletes (Scandinavian Journal of Medicine & Science in Sports). That does not mean every recreational athlete must copy elite skiers. It does mean weekly zone distribution can reveal whether your "easy" training is actually easy enough to support the hard days.
Look for these weekly signals:
- Easy days keep drifting into moderate zones.
- Hard days are not hard enough to create a clear stimulus.
- The week has more Zone 3 than planned.
- Recovery workouts are adding stress instead of reducing it.
- Heart rate is rising for the same output across several sessions.
- RPE is climbing while pace or power is flat or falling.
Weekly review also protects you from overreacting. A single hot workout does not mean your zones are broken. A month of consistent mismatch probably deserves a retest or training adjustment.
Mistakes To Avoid
Avoid five mistakes. Do not judge a workout only by average heart rate, because averages hide intervals, pauses, hills, warmups, cooldowns, and drift. Do not treat zones as moral labels: Zone 3 is not bad, and Zone 5 is not automatically better. Do not build conclusions on obvious spikes, dropouts, or impossible values, especially because wearable studies show wrist heart-rate accuracy can be useful but variable (JAMA Cardiology). Do not change zones after every strange workout, or you lose comparability. And do not ignore how you felt, because RPE, breathing, and recovery are also internal-response data.
Conclusion
Analyzing heart rate zones after a workout is not about chasing perfect percentages. It is about turning the workout file into a better next decision.
Start with the workout's purpose. Check time in zone. Look at where the time happened. Compare heart rate with pace, power, terrain, and RPE. Watch for drift. Add context. Then decide whether to keep the plan, recover, adjust intensity, improve measurement, or update your zones.
The most useful zone chart is not the one that looks impressive. It is the one that helps you train the right system on the right day and repeat that process over time.

Our editorial approach & AI disclosure
We use AI to help research, organize, and draft some articles. Every article is reviewed by a human editor and aims to reflect current evidence-based training practices and scientific literature.
Read our editorial policy