
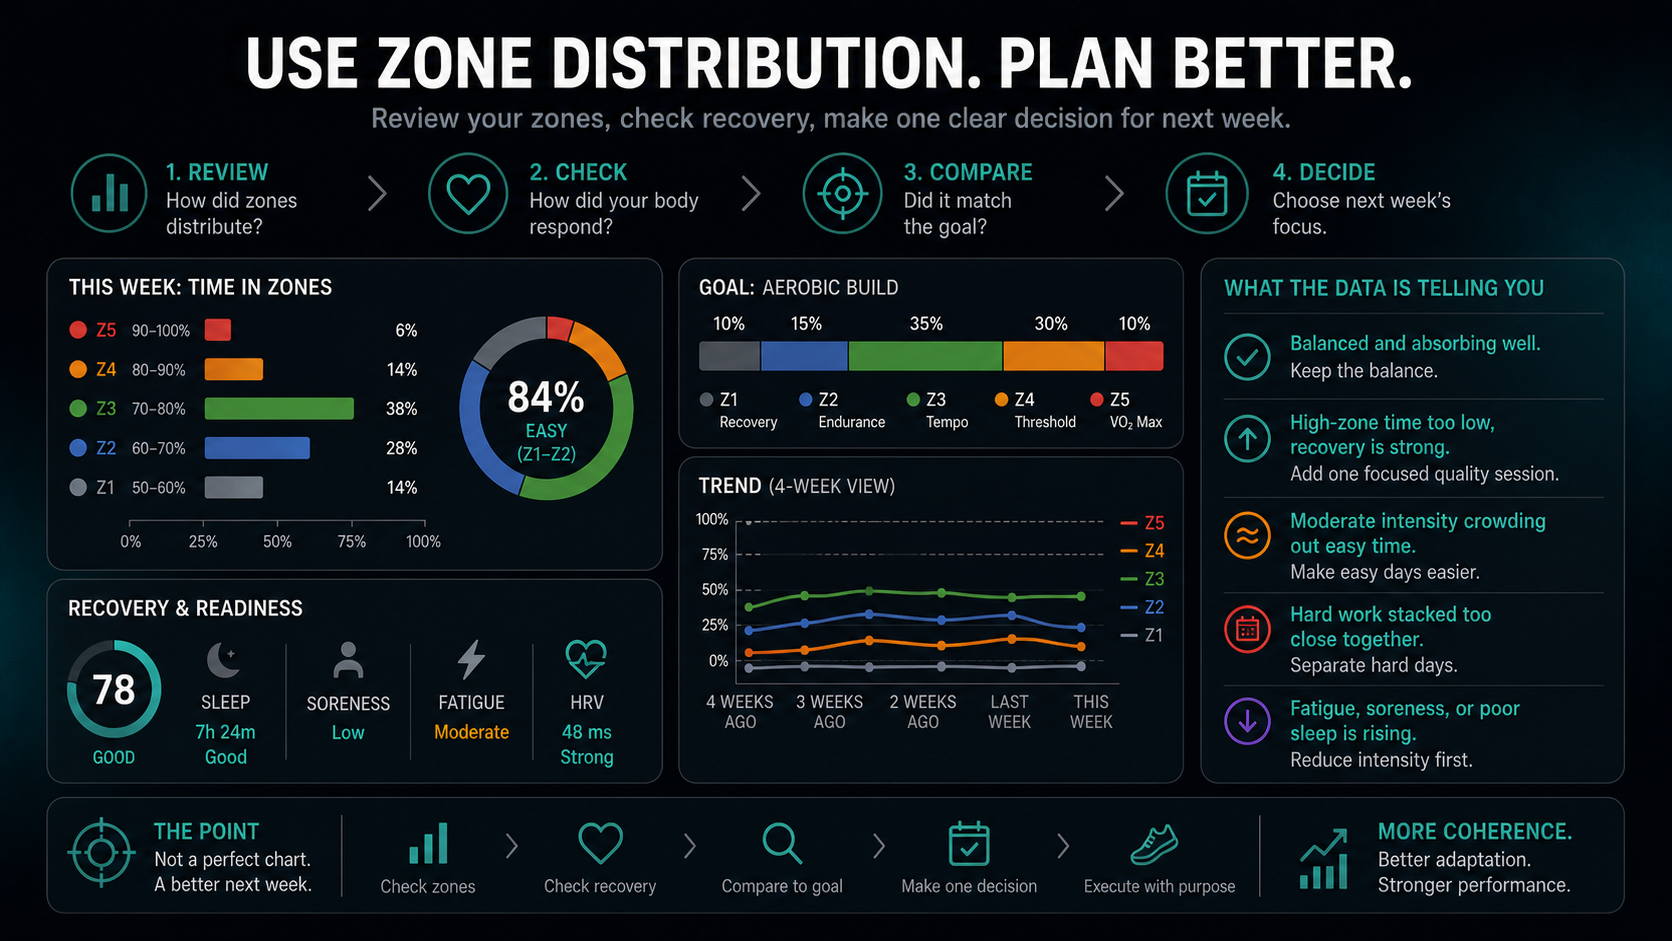
Review weekly zone distribution by comparing time in zones with the goal of the week, checking intensity drift, recovery response, hard-day placement, and the next adjustment.

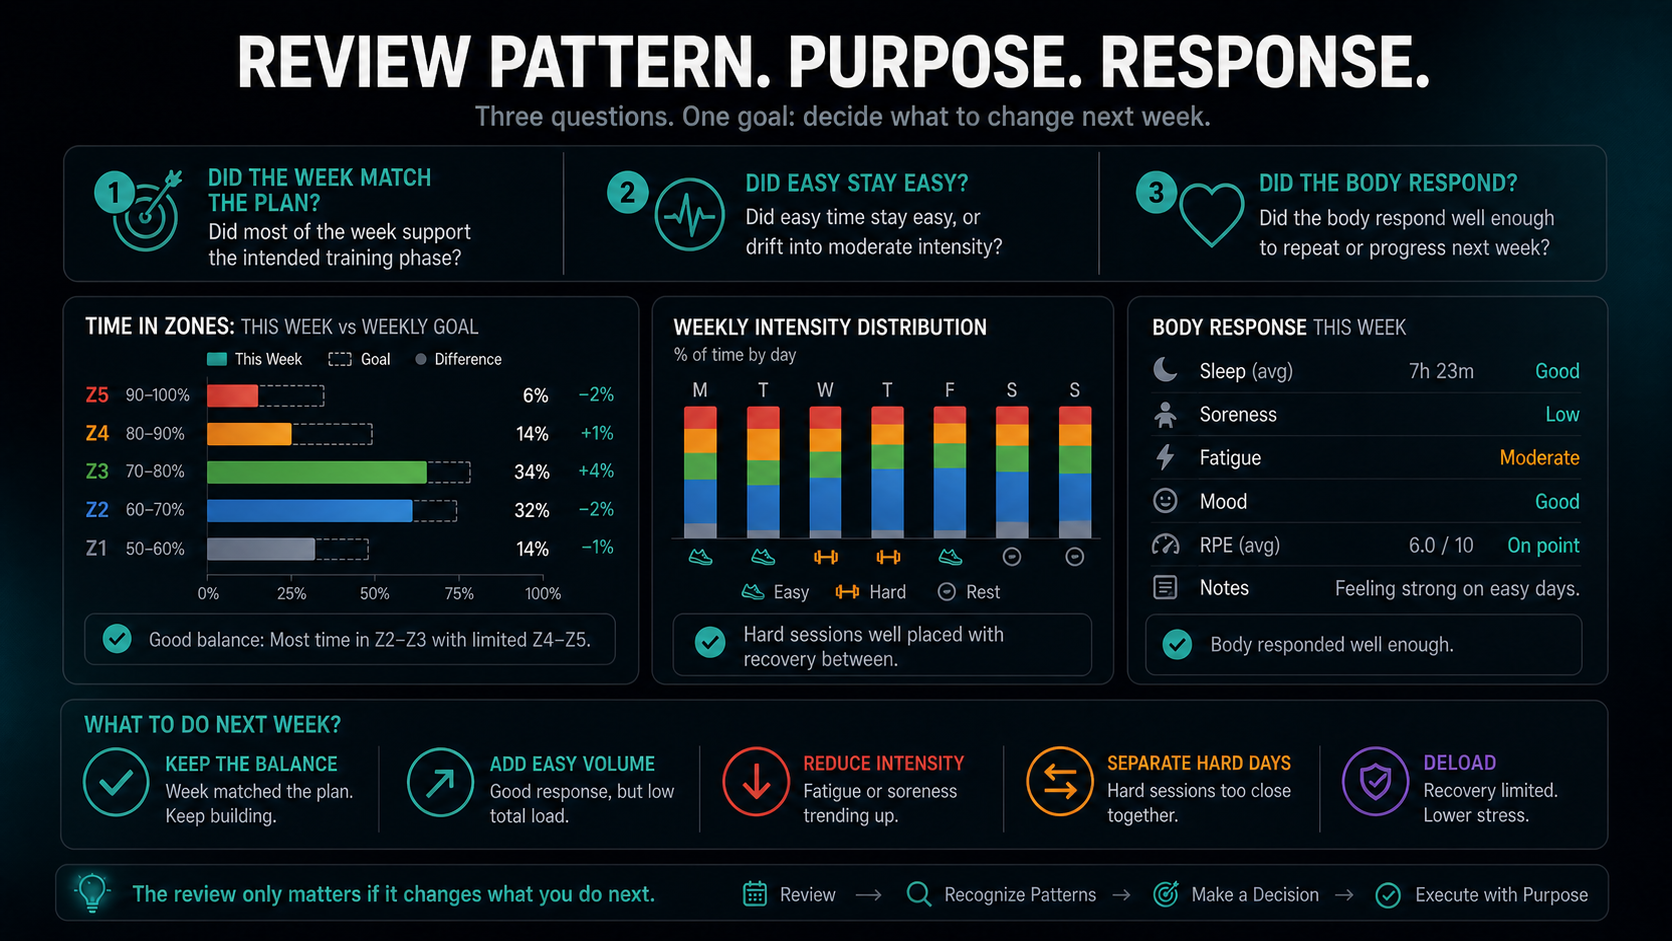
Review your weekly zone distribution by asking three questions: did the zones match the purpose of the week, did easy training stay easy, and did your body respond well enough to repeat or progress next week?
That is more useful than asking whether the chart looks perfect. A weekly zone distribution is a pattern, not a grade. It shows where your training time landed across intensity zones, but it does not explain everything by itself. You still need to compare it with the plan, the training phase, the placement of hard days, and recovery signals such as sleep, soreness, fatigue, mood, and perceived effort.
This matters because endurance training is not only about doing more. It is about putting the right stress in the right place. A training-load consensus statement describes load monitoring as a way to understand both the work performed and the athlete's response to that work (Bourdon et al., 2017). Impellizzeri, Marcora, and Coutts also emphasize that external load and internal load answer different questions (Impellizzeri et al., 2019). Zone distribution sits inside that larger picture.
If your week was supposed to be aerobic base training, the zone chart should probably show most time at low intensity. If your week included a focused VO2 max session, the chart should show a small amount of high-zone work and enough easy time around it. If your chart is full of moderate intensity but the plan said "easy," the week drifted.
The goal of the review is simple: use the zone chart to make next week more coherent.
Review your weekly zone distribution in this order:
The mistake is chasing one perfect percentage. A base week, build week, recovery week, taper week, and race week should not all look the same. The right distribution depends on the purpose of the week and whether your body absorbed the work.
Weekly zone distribution shows how much training time you spent in each intensity zone. Depending on your setup, zones may be based on heart rate, power, pace, threshold, lactate testing, critical power, or a field test.
Most endurance apps show something like this:
| Zone | Common Meaning | Typical Use |
|---|---|---|
| Z1 | Recovery or very easy | Warmups, cooldowns, recovery days |
| Z2 | Easy aerobic | Base volume, long easy work |
| Z3 | Moderate or tempo | Steady work, marathon-like efforts, aerobic pressure |
| Z4 | Threshold | Sustained hard work, intervals near threshold |
| Z5 | VO2 max or very hard | Shorter intense intervals, race-specific sharpening |
The exact boundaries vary. One athlete's Zone 3 may not match another app's Zone 3. A runner using heart-rate zones may see different patterns than a cyclist using power zones. Heart rate lags during short intervals, while power responds immediately. Heat, dehydration, fatigue, and terrain can also shift heart rate.
So do not review zones as if they are absolute truth. Review them as a structured clue. The question is not "Was my Zone 3 exactly correct?" The better question is "Did the week create the intensity pattern I intended?"
Start with the phase of training.
If the week was base training, you probably want most time in low zones, with maybe a small amount of strides, hills, or controlled tempo depending on the plan. If the week was build training, you still need plenty of easy time, but a small amount of threshold, VO2 max, race pace, or climbing work may be expected. If the week was a deload, taper, or recovery week, the zone distribution should usually show lower total load and less accumulated hard time.
Seiler's review of endurance intensity distribution reported that many successful endurance athletes perform a large share of training at low intensity, with a smaller amount of high-intensity work placed carefully (Seiler, 2010). That does not mean every athlete needs an exact 80/20 split every week. It does mean that low-intensity training is not filler, and that the weekly chart should make easy work visible.
Use the goal of the week as the reference point:
If the chart matched the goal and recovery was stable, keep the balance. If the chart matched the goal but recovery was poor, the problem may be total load, life stress, fueling, sleep, or session placement rather than zone distribution alone.
The most common weekly distribution problem is easy training that becomes moderate training.
This can happen quietly. A recovery run becomes "steady." A Zone 2 ride turns into a tempo ride because the route has climbs. A long run finishes faster than planned. A group ride pulls endurance work into repeated surges. By the end of the week, the chart has more Z3 or Z4 than intended, but no single session looked reckless.
This is intensity drift.
Look for these signs:
Intensity drift matters because it can steal recovery without giving the clear stimulus of a true workout. A week with too much moderate work may feel productive in the moment but leave you flat for key sessions.
The fix is usually simple: make easy days easier. That might mean slower running, flatter routes, lower power caps, riding alone instead of with a group, walking short climbs, or using heart rate as a ceiling rather than a trophy.
Not all high-zone time has the same meaning.
Ten minutes in Z5 from a planned VO2 max workout is different from ten minutes in Z5 created by sprinting every hill on an easy run. Twenty minutes in Z4 from threshold intervals is different from twenty minutes of accidental threshold at the end of a long ride.
When reviewing the week, identify the source of Z4-Z5 time:
This prevents false conclusions. If high-zone time was planned, well placed, and followed by good recovery, it may be a useful signal. If it appeared accidentally on easy days, it may be noise or a recovery cost.
Esteve-Lanao and colleagues studied training intensity distribution in endurance athletes and linked distribution patterns with performance outcomes (Esteve-Lanao et al., 2007). Stoggl and Sperlich also compared different distribution models and found that polarized training had a greater impact on key endurance variables than several other approaches in their study (Stoggl and Sperlich, 2014). These studies do not give every recreational athlete a universal weekly recipe, but they do support the practical idea that where intensity sits matters.
One week can be misleading. A four-to-six-week trend is more useful.
Ask:
A single Z3-heavy week may be appropriate during a marathon-specific block or hilly event preparation. Four Z3-heavy weeks in a row during base training may be a sign that easy training is not easy enough. A single high-Z5 week may happen during a 5K race week. Repeated high-Z5 weeks with poor sleep and rising soreness are different.
The trend also helps you avoid overcorrecting. If one week was messy because of travel, weather, or a race, do not rebuild the whole plan around it. If the same pattern repeats, act.
Zone distribution only becomes useful when you compare it with body response.
Halson's review on training-load monitoring emphasizes that fatigue is best understood by combining training load with how the athlete responds (Halson, 2014). This is why a weekly zone chart should be reviewed next to recovery and readiness data.
Look at:
If the zone distribution looks demanding and recovery looks stable, you may be adapting. If the distribution looks demanding and recovery is declining, the next week probably needs less intensity or more spacing. If the distribution looks easy but fatigue is high, the issue may be life stress, illness, poor fueling, lack of sleep, or accumulated load from earlier weeks.
This is why the chart should not be reviewed in isolation. A "good" distribution that leaves you exhausted is not good for you that week.
A zone review should end with a training decision.
Use these decision rules:
| What You See | What It May Mean | Next Step |
|---|---|---|
| Mostly easy, recovery stable | Week matched aerobic goal | Keep balance or progress slightly |
| Mostly easy, low total load, recovery strong | More capacity available | Add easy volume before more intensity |
| Z3 crowded out Z1-Z2 | Easy work drifted moderate | Make easy days easier |
| Z4-Z5 came from planned workouts | Quality was intentional | Keep if recovery is stable |
| Z4-Z5 came from easy days | Hidden intensity | Cap effort or choose easier routes |
| Hard days stacked close together | Stress placement problem | Separate hard sessions |
| Fatigue, soreness, or poor sleep rising | Load not absorbed | Reduce intensity first |
| Pain appears with high-zone work | Risk signal | Modify sessions and monitor closely |
The key is to change the smallest thing that solves the pattern. You do not need to rewrite the whole plan because one chart looked imperfect.
The first mistake is chasing a perfect 80/20 number every week. The 80/20 idea can be a useful reminder that easy training matters, but individual weeks vary. A recovery week, race week, and threshold-focused week will not have identical charts.
The second mistake is ignoring the training phase. A base week with too much Z4-Z5 is different from a build week with a planned quality session. A marathon-specific week may include more moderate work than a 5K sharpening week.
The third mistake is trusting bad zone settings. If threshold pace, threshold power, max heart rate, or heart-rate zones are wrong, the weekly distribution can mislead you. Review field tests and thresholds periodically, especially after major fitness changes.
The fourth mistake is comparing heart-rate zones and power zones as if they behave the same. Heart rate lags, drifts, and responds to heat or fatigue. Power and pace respond faster but do not fully show internal strain.
The fifth mistake is ignoring warmups, cooldowns, and recovery between intervals. They are part of the session. A hard workout can still contain a lot of easy time, which is normal.
The sixth mistake is treating the chart as more important than the athlete. If your zone distribution looks good but your sleep, soreness, and mood are deteriorating, listen to the full review.
Use this template once per week:
| Review Question | What To Check |
|---|---|
| What was the goal? | Base, build, recovery, taper, race-specific, or maintenance |
| Where did time go? | Percent and total time in Z1-Z5 |
| Did easy stay easy? | Z1-Z2 share, Z3 creep, long-session drift |
| Where did hard work come from? | Planned workouts, races, hills, group rides, accidental surges |
| What changed from recent weeks? | Four-to-six-week trend |
| How did the body respond? | Sleep, soreness, fatigue, mood, pain, session RPE |
| What is next? | Keep, add easy volume, reduce intensity, separate hard days, deload |
Example note:
Base week. 82% Z1-Z2, 13% Z3, 5% Z4-Z5. Long run drifted into Z3 late, but sleep and soreness were stable. Next week: keep total volume similar, choose flatter long-run route, add no extra intensity.
Another example:
Build week. Planned threshold session created most Z4. Easy rides stayed easy. Recovery stable. Next week: progress threshold volume slightly, keep recovery ride capped.
This is all a review needs to do. It should explain the week and shape the next one.
Review your weekly zone distribution by comparing pattern, purpose, and response.
First, ask whether the zones matched the goal of the week. Then check whether easy training stayed easy, where hard-zone time came from, how the trend compares with recent weeks, and whether your body absorbed the load.
Do not chase a perfect chart. Use the chart to make a better decision. Keep the balance when the week worked. Add easy volume when recovery is strong and load is low. Reduce hidden intensity when easy days drift moderate. Separate hard days when stress is stacked. Deload when fatigue, soreness, poor sleep, or pain are rising.
The weekly zone review is not about proving discipline. It is about making next week more coherent.
Related


