
Calculate heart rate zones by choosing a method, finding your max and resting heart rate, then applying zone percentages. Learn the formulas, examples, and when to use each method.

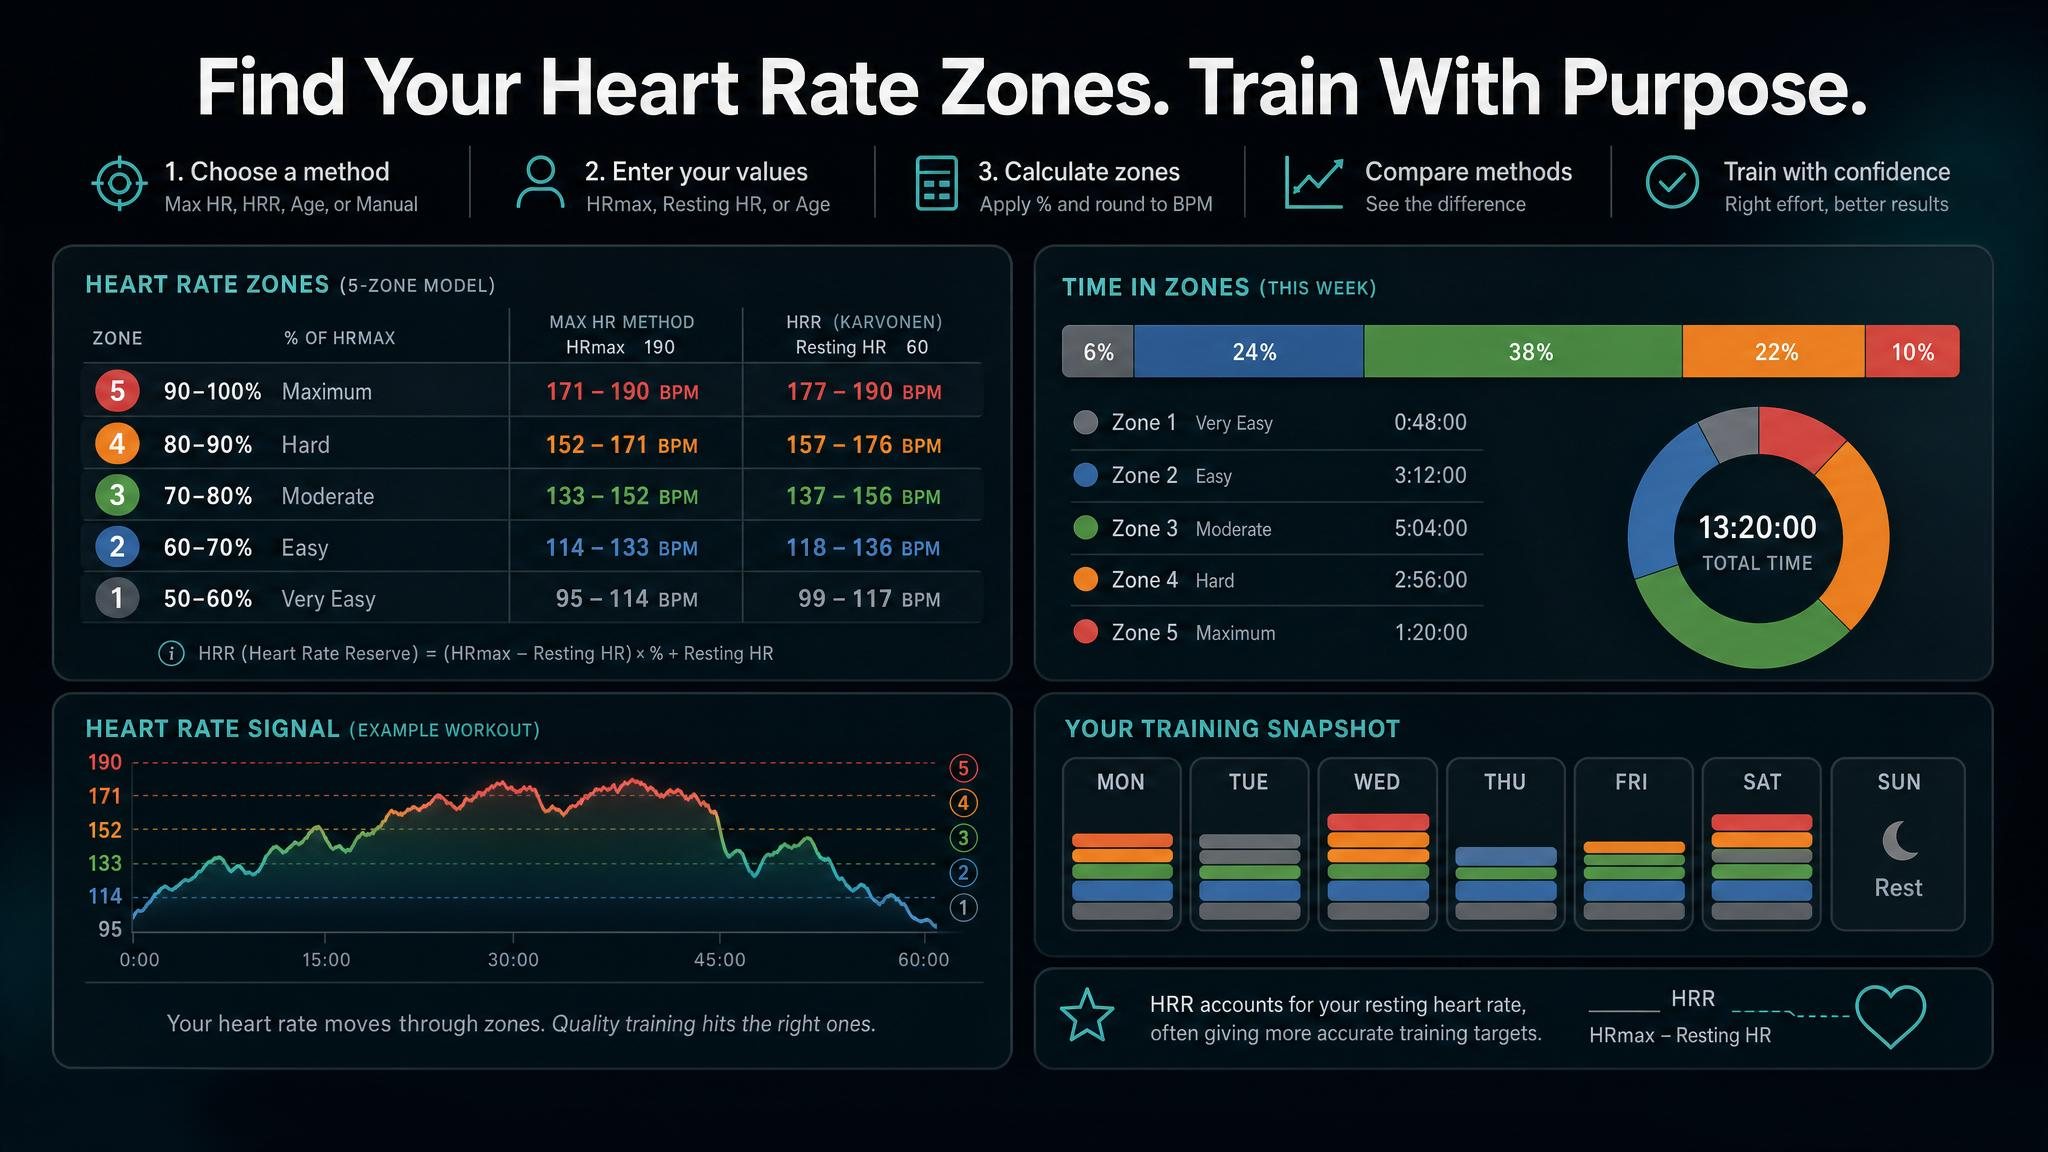
You calculate heart rate zones by choosing a zone method, finding the heart rate values that method needs, and applying percentages to turn those values into beats-per-minute ranges. The most common five-zone model uses maximum heart rate: Zone 1 is 50-60% of HRmax, Zone 2 is 60-70%, Zone 3 is 70-80%, Zone 4 is 80-90%, and Zone 5 is 90-100%, which matches the standard zone ladder used by Polar's heart rate zone guidance (Polar).
That simple answer hides the important part: the input value matters more than the arithmetic. If your maximum heart rate estimate is wrong, every zone based on it will be wrong. If your resting heart rate is reliable, heart-rate reserve can make the calculation more personal. If you have tested threshold data, manual or threshold-based zones may fit your training better than a generic percentage table.
Use this guide as a practical calculation workflow, not a medical prescription. Heart rate can be affected by heat, sleep, hydration, stress, caffeine, terrain, fitness, and medication. The American Heart Association notes that some medications can lower maximum heart rate and target zones, so people with heart conditions or heart-rate-affecting medication should ask a clinician what range is appropriate for them (American Heart Association).
To calculate heart rate zones:
For a five-zone max-HR model, the formula is:
zone boundary = maximum heart rate x zone percentage
For a five-zone heart-rate-reserve model, the formula is:
zone boundary = ((maximum heart rate - resting heart rate) x zone percentage) + resting heart rate
The heart-rate-reserve formula uses the space between your resting and maximum heart rate instead of treating zero as the baseline. Cleveland Clinic describes heart rate reserve as maximum heart rate minus resting heart rate, and notes that this approach can be used to estimate target workout heart rates (Cleveland Clinic). It is commonly associated with the Karvonen method, named after Karvonen, Kentala, and Mustala's early training and heart-rate research (PubMed).
Use the calculator below to compare methods. The standalone version is also available at the Heart Rate Zone Calculator.
Related
Percent of maximum heart rate is the easiest method to understand. You take a maximum heart rate value and multiply it by the percentage boundary for each zone.
Example with HRmax = 180 bpm:
| Zone | Percentage | Calculation | Range |
|---|---|---|---|
| Zone 1 | 50-60% | 180 x 0.50 to 180 x 0.60 | 90-108 bpm |
| Zone 2 | 60-70% | 180 x 0.60 to 180 x 0.70 | 108-126 bpm |
| Zone 3 | 70-80% | 180 x 0.70 to 180 x 0.80 | 126-144 bpm |
| Zone 4 | 80-90% | 180 x 0.80 to 180 x 0.90 | 144-162 bpm |
| Zone 5 | 90-100% | 180 x 0.90 to 180 x 1.00 | 162-180 bpm |
This method is useful when you know your maximum heart rate from a reliable field test, lab test, or repeated hard workouts. It is also the model many people recognize from public guidance. The American Heart Association uses the age-predicted maximum heart rate idea for target heart rate ranges and lists moderate activity around 50-70% of maximum heart rate and vigorous activity around 70-85% (American Heart Association).
The weakness is obvious: the calculation is only as good as HRmax. If your real maximum is 195 but your formula estimate says 180, Zone 2 will be too low, Zone 4 will arrive too early, and a normal hard workout may look artificially extreme.
Heart-rate reserve, often called HRR, adds resting heart rate to the calculation. This can be useful because two athletes with the same maximum heart rate may have very different resting heart rates and therefore different usable ranges.
Example with HRmax = 180 bpm and resting HR = 50 bpm:
180 - 50 = 130(130 x 0.60) + 50 = 128 bpm(130 x 0.70) + 50 = 141 bpmSo Zone 2 by HRR is roughly 128-141 bpm for this example. That is much higher than the 108-126 bpm Zone 2 from the simple max-HR method. Neither number is automatically perfect. They are different models using different assumptions.
Choose HRR when you know both HRmax and resting heart rate. Measure resting heart rate under consistent conditions, usually after waking and before caffeine, training, or work stress. Do not use a single odd reading after poor sleep or illness as the basis for all zones.
HRR is especially helpful for athletes whose resting heart rate is low relative to their maximum. It can also make zones feel more realistic when percent-of-max zones seem too conservative. But it still depends on a valid HRmax and a stable resting value.
If you do not know your maximum heart rate, an age formula can give you a starting point. The familiar public-health estimate is:
estimated HRmax = 220 - age
For a 40-year-old, that gives an estimated HRmax of 180 bpm. From there, you can multiply by the same zone percentages used in the max-HR method.
A research-backed alternative is the Tanaka equation:
estimated HRmax = 208 - (0.7 x age)
Tanaka, Monahan, and Seals proposed that equation after analyzing measured maximum heart rate data and validating the model in healthy adults (Journal of the American College of Cardiology). For a 40-year-old, the Tanaka equation estimates 180 bpm as well. At older ages, it often estimates a higher HRmax than 220 minus age.
Age-estimated zones are useful when you need a first pass today. They are weak when you treat them like personal physiology. People of the same age can have meaningfully different maximum heart rates, and fitness watches may update or personalize zones when they have better data. Apple, for example, describes Watch heart rate zones as percentages of maximum heart rate that can be calculated from health data or adjusted manually (Apple Support).
Use age estimates to start training, then revise zones when repeated workouts show the estimate does not match reality.
Manual zones are best when you already have better evidence than a generic formula. That might come from a lab test, a coached field test, a lactate-threshold heart rate test, or several months of trustworthy training data.
This matters because training zones are not only math labels. They are supposed to represent usable intensity ranges. Garmin, for example, documents zone setup options based on maximum heart rate, heart-rate reserve, and lactate threshold heart rate on compatible devices (Garmin Support). TrainingPeaks also emphasizes setting thresholds correctly because many of its workout and analysis metrics depend on threshold values (TrainingPeaks).
Manual zones are not automatically more accurate. They are better only when the underlying test or coaching input is better. If you manually copy another athlete's ranges, you have made the zones less personal, not more.
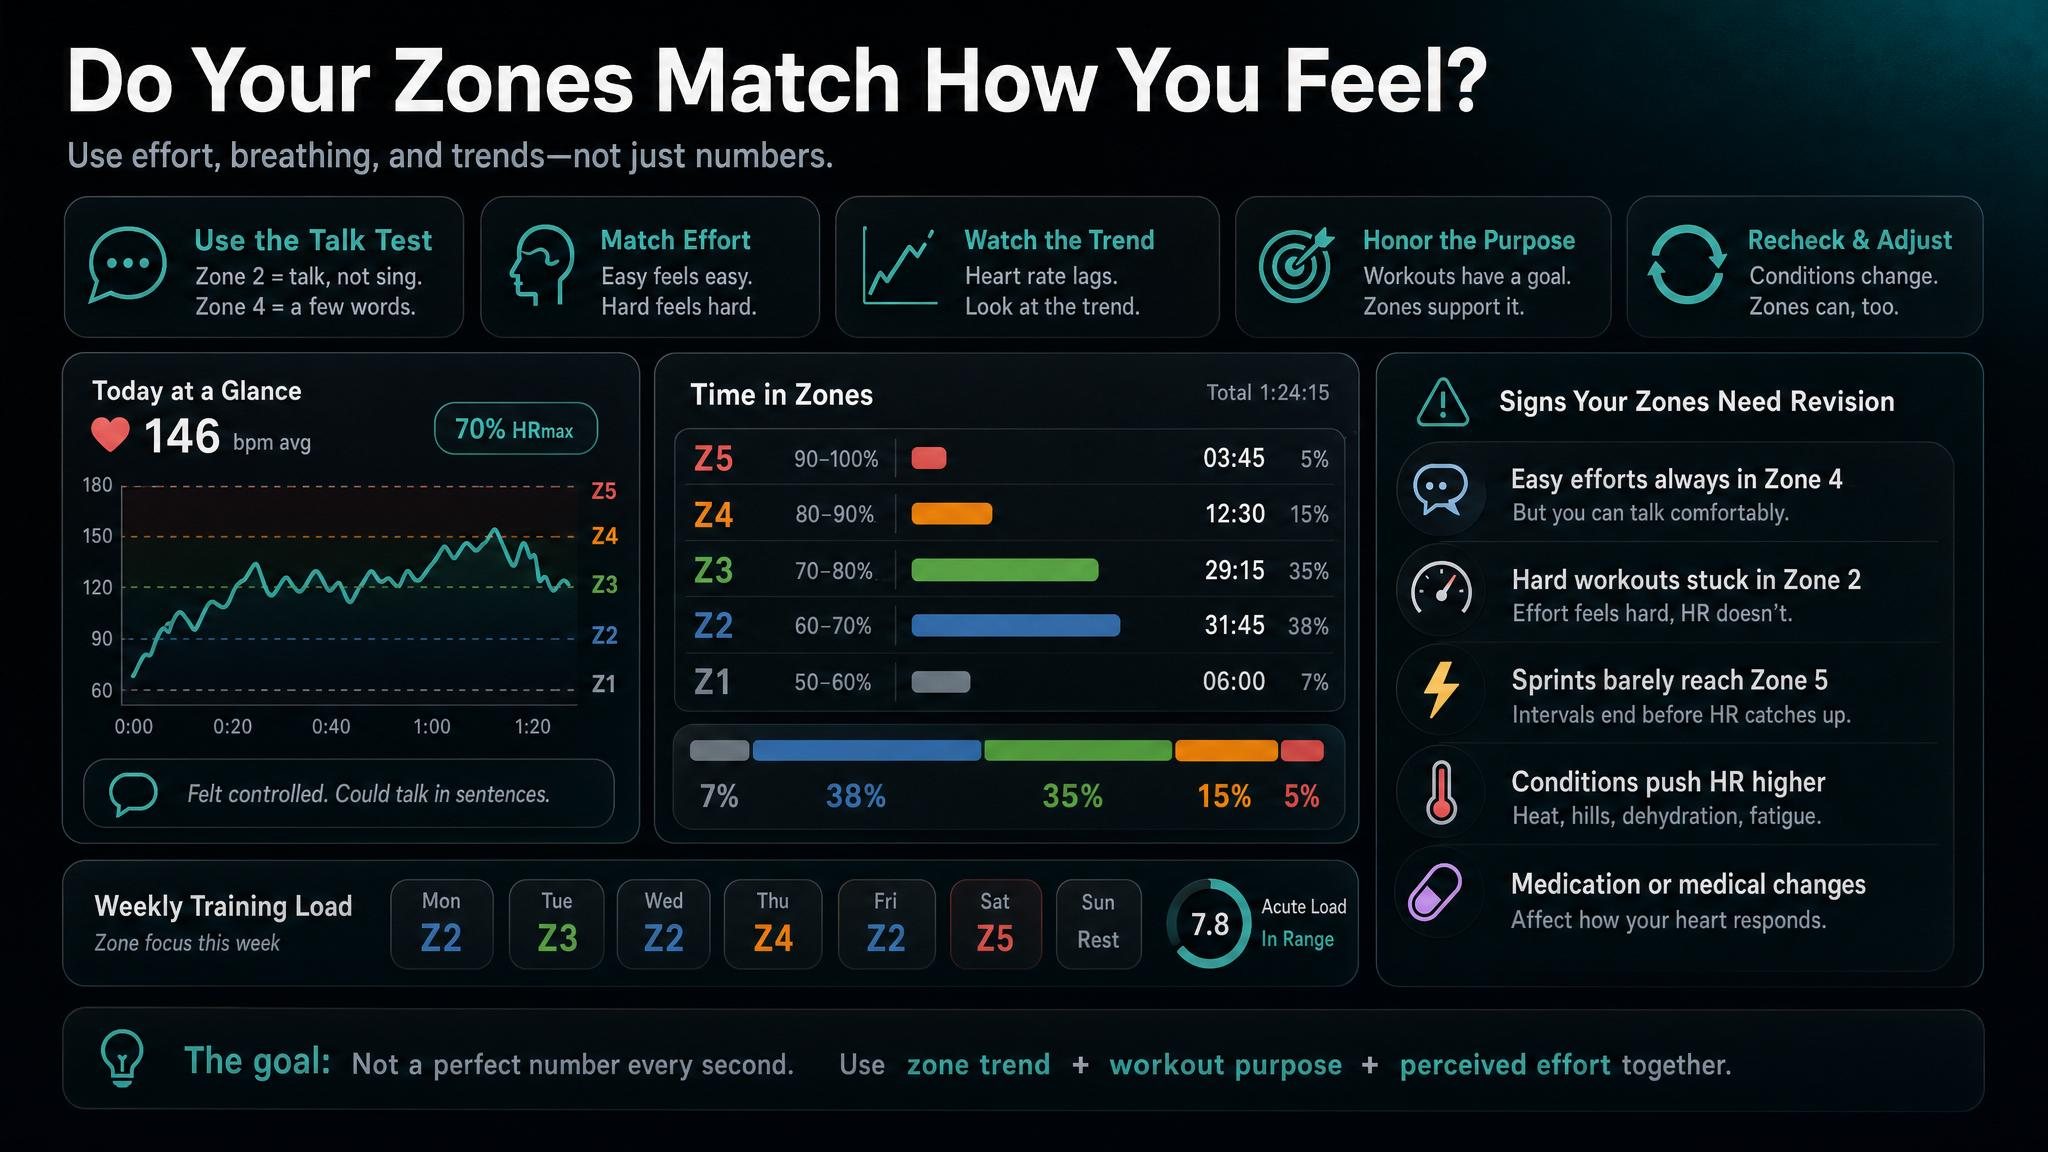
After you calculate zones, check them against effort. A practical Zone 2 should feel controlled and conversational. Zone 4 should feel hard and focused. Zone 5 should feel very hard and usually belongs in short, planned intervals.
The CDC's talk test is a useful cross-check for broad intensity: moderate activity usually allows talking but not singing, while vigorous activity makes it hard to say more than a few words without pausing for breath (CDC). Five-zone endurance models are more detailed than public-health intensity bands, but breathing is still a good reality check.
Watch for these signs that your zones need revision:
The goal is not to chase a perfect number every second. Heart rate lags behind changes in effort, especially during short intervals. Use the zone trend, the workout purpose, and your perceived effort together.
Use percent of maximum heart rate if you know a realistic HRmax and want a simple, widely understood five-zone model. It is easy to explain, easy to audit, and useful for most everyday endurance training.
Use heart-rate reserve if you know both HRmax and resting heart rate, especially if percent-of-max zones feel too low. HRR is more personal because it accounts for your resting baseline.
Use age-estimated zones if you have no better information yet. They are fine for a first setup, but they should be treated as estimates, not proof.
Use manual or threshold-based zones if you have tested data or coach-provided thresholds. This is often the best option for athletes who train seriously by sport, especially when running, cycling, rowing, and swimming produce different heart-rate responses.
The most common mistake is using a maximum heart rate that is too low. This often happens when someone relies only on 220 minus age. If the estimate is 15 bpm below your real maximum, every zone boundary will be pulled down.
The second mistake is mixing methods without noticing. A Zone 2 range from HRR will not match a Zone 2 range from percent of maximum heart rate. Compare methods intentionally, then choose the one that matches your data and training purpose.
The third mistake is using resting heart rate casually. HRR depends on a reliable resting value, so use a consistent morning average rather than one stressed or dehydrated reading.
The fourth mistake is assuming zones are universal. A cyclist's heart-rate threshold may not be the same as a runner's. Hills, heat, altitude, illness, caffeine, and poor sleep can all change the number you see during a workout.
Heart rate zones are calculated by turning a reference value into training ranges. The simplest method multiplies maximum heart rate by zone percentages. Heart-rate reserve subtracts resting heart rate first, multiplies the reserve, then adds resting heart rate back. Age formulas estimate HRmax when you do not know it, and manual zones use better tested data when you have it.
Start with the best data available, use the Heart Rate Zone Calculator to compare methods, and then check the result against how training actually feels. The right zones should make your workouts clearer, not make every run, ride, or session feel like a math test.


