

Training Log & Analytics
How Do You Compare Training Weeks by Zone?
Compare training weeks by zone by looking at total time, zone distribution, planned intensity, easy-day control, effort, and the next decision.

Introduction
To compare training weeks by zone, start with total training time, then compare how that time was distributed across heart-rate zones. The key is not only whether this week was bigger than last week. The key is whether the shape of the week matched the goal: enough easy time, the right amount of planned intensity, no accidental drift into the middle, and a next workout that still makes sense.
This is why weekly zone comparison is more useful than looking at one workout in isolation. One run can be noisy. One ride can be affected by wind, heat, hills, sleep, caffeine, or a sensor issue. A week gives you a pattern. It shows whether easy days stayed easy, whether hard work was concentrated in the right sessions, whether Zone 3 kept expanding, and whether total volume changed faster than your body could absorb.
Training-load researchers separate external load, such as distance, pace, power, elevation, and duration, from internal load, such as heart rate and perceived effort. A consensus statement on monitoring athlete training loads describes this distinction as central because the same external work can produce different internal stress in different conditions or athletes (Bourdon et al.). Weekly zone comparison is a practical way to organize that internal-load signal.
Zone Training Log is built around this review. It turns Apple Health and Health Connect workouts into a heart-rate-zone training log, then lets you review daily, weekly, monthly, or custom summaries to understand zone distribution, consistency, readiness, volume, and long-term trends. The goal is not to admire the chart. The goal is to decide whether to build, absorb, or adjust.
What Comparing Weeks By Zone Actually Means
Comparing weeks by zone means comparing the distribution of intensity, not just the size of the week. Two weeks can both contain five hours of training and still be completely different.
Week A might include four hours in Zone 1-2, 35 minutes in Zone 3, and 25 minutes in Zone 4-5. Week B might include two hours in Zone 1-2, two hours in Zone 3, and one hour in Zone 4-5. The total time is the same. The training stress, recovery cost, and likely adaptation are not.
For endurance athletes, that distribution matters because most endurance plans are built around a balance between low-intensity volume and targeted harder work. Seiler and Kjerland studied well-trained endurance athletes and found that most endurance training time occurred below the first ventilatory threshold, with a smaller share at higher intensities (Scandinavian Journal of Medicine & Science in Sports). That does not mean every athlete should copy one exact split, but it does show why intensity distribution is worth tracking.
The practical weekly comparison has four layers:
- Total training time: how big was the week?
- Time in each zone: where did the minutes go?
- Workout context: were the higher-zone minutes planned?
- Trend and readiness: what does this imply for next week?
If you only compare total time, you miss the shape. If you only compare percentages, you miss the dose. A good weekly review combines both.
Use The Same Zone System Before You Compare
Weekly comparisons only make sense if the zone system is stable. If you change your maximum heart rate, resting heart rate, threshold, or zone method between weeks, the chart may change even when your training did not.
This is a common reason athletes misread their data. One week looks suddenly easier or harder, but the real change was the zone definition. A workout that used to count as Zone 3 may now count as Zone 2. That can be a good correction, but old and new weeks need to be recalculated or interpreted carefully.
Heart-rate zones are estimates unless they come from recent individualized testing. Age-based maximum-heart-rate formulas can be useful starting points, but they are population estimates, not personal truth. Tanaka, Monahan, and Seals proposed the widely used 208 minus 0.7 times age equation, but individual variation remains large enough to affect training-zone placement (Journal of the American College of Cardiology01054-8)).
Before comparing weeks, check:
- The same sport uses the same relevant zone model.
- Zone thresholds have not silently changed.
- The zone labels still match breathing and perceived effort.
The last point matters. The CDC's talk-test guidance is a useful reality check: at moderate intensity, you can talk but not sing; at vigorous intensity, speaking more than a few words becomes difficult (CDC). If your "easy" Zone 2 week felt like constant controlled breathing and limited talking, the zone setup may deserve review.
Zone Training Log supports editable zones and different setup approaches, including maximum heart rate, heart-rate reserve, age-based methods, and manual thresholds. When you refine your zones, consistent recalculation matters because the weekly comparison should reflect training changes, not bookkeeping changes.
Start With Total Time, Then Time In Each Zone
The first weekly comparison should be simple: total time this week, total time last week, and minutes in each zone. Minutes matter because training dose is time-based. Percentages matter because they reveal shape.
For example, suppose last week was 4 hours and this week was 5 hours. A 25 percent increase may be reasonable for one athlete and too aggressive for another, depending on history and training phase. But the zone breakdown tells the more important story. If the extra hour was mostly easy Zone 1-2 time, the week may be a controlled volume build. If it was mostly Zone 3-4, the week changed more than the total-time number suggests.
Use both views:
| Metric | What it answers | Why it matters |
|---|---|---|
| Total time | How big was the week? | Shows the gross training dose |
| Zone minutes | Where did time accumulate? | Shows the actual intensity load |
| Zone percentage | What shape was the week? | Makes different-length weeks comparable |
| Workout count | How was time distributed? | Separates one big day from steady frequency |
| Effort/RPE | How did it feel? | Adds context heart rate cannot know |
Do not overinterpret tiny changes. Five extra minutes in Zone 3 may mean nothing. A repeated increase over several weeks, especially with rising perceived effort, is more meaningful.
Many athletes use five zones, but weekly decisions often become clearer if you first group them:
- Low: recovery and easy endurance zones.
- Middle: steady moderate work that is harder than easy but not truly hard.
- High: threshold, VO2 max, intervals, hard climbs, races, or sustained vigorous work.
After that broad read, go back into the individual zones. A week with more Zone 3 is different from a week with more Zone 5, even if both increase "above easy" time.
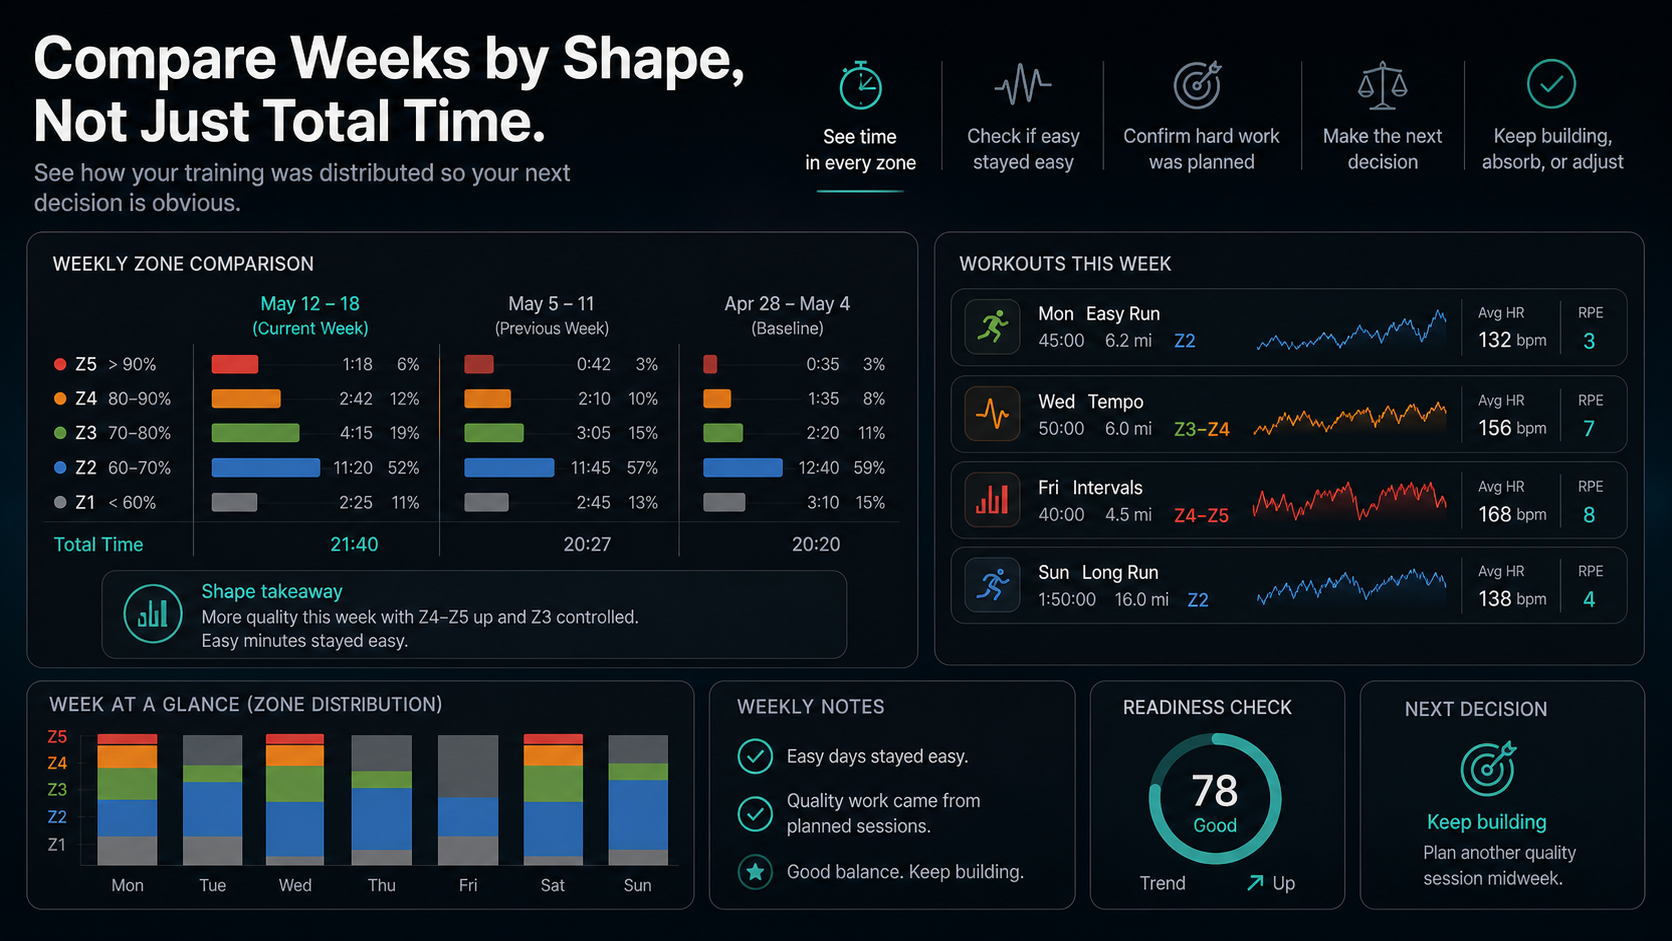
Compare Weeks By Shape, Not Just Total Time
A useful weekly zone comparison starts with total training time and time in each zone. Then it looks at the shape of the week. Did the easy minutes stay easy? Did hard-zone time come from planned workouts? Did Zone 3 grow because workouts drifted, or because the plan added tempo work?
The shape matters because two training weeks can create different stress even with similar volume. A mostly easy five-hour week may support aerobic development and recovery. A five-hour week packed with moderate and high-intensity work may require more recovery and carry a higher chance of carrying fatigue into the next block.
This is not about forcing every week into one model. Stoggl and Sperlich compared different training-intensity distributions in trained athletes and found that how intensity is organized can influence adaptation (Frontiers in Physiology). The practical takeaway is that distribution is a training variable, just like volume.
When comparing week shape, ask:
- Did low-zone time increase, decrease, or stay stable?
- Did moderate-zone time appear on days that were supposed to be easy?
- Did high-zone time come from planned quality sessions?
- Did the week contain enough easy time around hard workouts?
- Did the distribution match the current phase: base, build, race-specific, taper, or recovery?
Zone Training Log's weekly summaries are useful here because a stacked zone view makes the pattern visible quickly, while workout titles, tags, notes, and effort scores explain why it happened.
Compare Against Three References
Do not compare this week only with last week. Last week might have been unusual. It may have been a recovery week, a race week, a travel week, or a week with missing data. A better review compares the current week against three references.
The first reference is the previous week. This shows short-term change. Did total time rise sharply? Did Zone 4-5 double? Did Zone 2 drop? This is the fastest way to catch a sudden load jump.
The second reference is a recent baseline, such as the average of the last four weeks. This shows whether the week was normal for you. A five-hour week may be a huge jump for one athlete and a normal maintenance week for another.
The third reference is the intended plan. This is the one many athletes skip. A week can look "balanced" and still fail the plan. If the goal was a recovery week, even a normal-looking week may be too much. If the goal was a focused threshold block, a week with no meaningful hard work may be too light.
Use a three-column mental model:
| Compare this week to | Main question |
|---|---|
| Previous week | What changed quickly? |
| Recent baseline | Is this normal for me? |
| Planned week | Did I do what I meant to do? |
Training logs are strongest when they preserve both outcome and intention. Zone Training Log supports planned workouts and can match completed sessions back to the plan.
Separate Planned Intensity From Accidental Intensity
The most important weekly zone question is not "How much hard time did I do?" It is "Was the hard time intentional?"
Planned intensity is a workout doing its job. A tempo run, hill repeat session, threshold ride, race, or progression long run should create above-easy time. Accidental intensity appears when easy runs become steady, recovery rides drift upward, commutes turn into workouts, or long days creep from Zone 2 into Zone 3 because you started too fast.
Accidental intensity can crowd out both recovery and quality. A week with one planned hard session and mostly easy work is different from a week where every "easy" day contains a moderate block.
Heart rate can be affected by conditions, so do not blame yourself automatically. Achten and Jeukendrup's review of heart-rate monitoring notes that heart rate is useful for training prescription and monitoring, but interpretation depends on individual physiology, environment, and exercise conditions (Sports Medicine). Heat, dehydration, stress, and fatigue can turn a normal workout into a higher-zone day.
To separate planned from accidental intensity, review each workout with its purpose:
- Easy workout: did it stay mostly low zone?
- Long workout: did it drift late, and was that acceptable?
- Quality workout: did it reach the target zone without turning into a race?
- Recovery workout: did it actually reduce stress?
- Race or event: should it be excluded from normal weekly comparisons?
If the week contains too much accidental Zone 3, the next adjustment is often simple: slow the first 15 minutes, choose flatter terrain, shorten recovery days, use a heart-rate cap, or move the next hard session.
Add Effort, Distance, Elevation, And Notes
Weekly zone comparison should not ignore the work you actually did. Heart rate is an internal response. Distance, elevation, speed, pace, and power are external output. Training-load monitoring is more useful when internal and external load are interpreted together (Bourdon et al.).
Imagine two weeks with the same zone distribution. In week one, you ran 30 miles with 1,000 feet of climbing. In week two, you ran 30 miles with 4,000 feet of climbing on trails. The zones may look similar, but the muscular load and recovery cost may not be the same.
Effort is the other missing layer. Session rating of perceived exertion, often called session RPE, is a practical way to summarize how hard a workout felt. Foster's approach to monitoring exercise training used session RPE with duration to quantify training load and also introduced ideas such as monotony and strain for understanding repeated load patterns (Foster).
You do not need a complicated formula to benefit from this. When comparing weeks, check whether the zone chart and effort scores agree:
Common patterns:
- Same zones, higher effort may mean fatigue, heat, stress, or poor recovery.
- More Zone 3 plus higher effort may mean the week drifted too hard.
- More high-zone time with stable effort may mean planned intensity landed well.
- Lower zones but high effort may mean fatigue, terrain, fueling, or sensor error.
Notes and tags make this review much stronger. "Hot," "hilly," "poor sleep," "race," "travel," or "felt great" can explain a weekly chart that otherwise looks confusing.
Watch For Drift Across Multiple Weeks
Drift inside one workout matters. Drift across several weeks matters more. If easy workouts repeatedly spend more time in Zone 3, the training plan may be getting harder even if total time is stable.
Cardiovascular drift during prolonged exercise is a real physiological pattern. Coyle and Gonzalez-Alonso describe how heart rate can rise and stroke volume can fall during prolonged exercise, especially with heat stress or dehydration (Exercise and Sport Sciences Reviews). In a weekly review, the question is whether drift is an isolated workout condition or a repeated training pattern.
Look for:
- Zone 2 time is falling while Zone 3 rises.
- Easy-day effort scores are rising.
- Long workouts show more late-zone climb.
- The same route produces higher heart rate at similar pace.
- Recovery workouts no longer look like recovery.
One hot week is context. Three weeks of creeping moderate intensity is a pattern. If that pattern appears, the next week should probably absorb more and force less.
The opposite pattern is also useful. If easy-zone time increases while effort stays stable and pace improves slightly, the aerobic base may be progressing. If hard-zone time is concentrated in planned sessions and easy days remain easy, the week may be well structured.
Decide Whether To Build, Absorb, Or Adjust
Weekly comparison should end with a decision. A chart without a decision becomes noise.
Use three options:
Build: The week matched the plan, easy time stayed easy, hard work was intentional, and effort was stable. You can keep the next planned progression, such as slightly more volume, a similar quality session, or a longer aerobic day.
Absorb: The week was productive but costly. Zone distribution may be fine, but total load, effort, life stress, race fatigue, or late drift suggests you should consolidate. Keep the next week similar or reduce intensity slightly.
Adjust: The week missed the goal. Maybe easy days became moderate, hard work was not planned, total time jumped too fast, or effort rose while output fell. Change the next week before the pattern becomes a problem.
This decision should be proportional to the evidence. Do not rewrite the plan after one odd workout, but do not ignore a repeating pattern because the total hours look fine.
Zone Training Log's readiness and zone balance views are useful checks here. They are not medical diagnoses and should not override symptoms or common sense, but they help you ask whether recent load looks balanced, heavy, or ready for the next step.
A Ten-Minute Weekly Zone Review
You can compare training weeks by zone in about ten minutes.
- Open the weekly summary and check total training time.
- Compare time in each zone with last week.
- Compare zone percentages with your recent baseline.
- Identify where higher-zone time came from.
- Check whether easy workouts stayed mostly easy.
- Review effort scores, notes, distance, elevation, and workout tags.
- Compare the completed week with the plan.
- Decide: build, absorb, or adjust.
If you use Zone Training Log, this workflow fits naturally into weekly summaries. The app can show time in zones, average heart rate, effort, distance, daily and weekly summaries, zone distribution, readiness, and long-term trends. It can also keep titles, tags, notes, and planned workouts attached to the sessions that created the chart.
The right decision often depends on context. A week with more Zone 4 might be excellent if it came from a planned interval session after a recovery week. The same increase might be a warning if it came from three easy runs that turned into races.
Common Weekly Comparison Mistakes
Avoid six common mistakes. Do not compare only total hours. Do not compare percentages without minutes. Do not treat Zone 3 as always bad, because it can be appropriate in tempo work, hills, racing, long endurance events, or specific phases. Do not change zones and compare old charts as if nothing changed. Do not overanalyze weeks with missing heart-rate data, loose-watch recordings, or imported files with gaps. And do not make medical conclusions from training charts: unusual symptoms, chest pain, faintness, severe breathlessness, or unexplained abnormal readings deserve medical attention, not a spreadsheet explanation.
How Zone Training Log Helps
Zone Training Log is designed to make this weekly comparison easier. On iOS, it reads Apple Health data only after HealthKit permission. The privacy policy says it can read workouts, heart rate, routes when available, resting heart rate, energy, distance, effort metrics, running and cycling power, and date of birth where needed for zone calculations. It can use this data to compute training zones, summaries, route displays, and your training log (Zone Training Log Privacy Policy).
The workflow is built around the same sequence this article recommends:
- Connect Apple Health or Health Connect.
- Set heart-rate zones that match how you train.
- Log workouts with titles, notes, tags, effort, and context.
- Review each session's time in zones and key metrics.
- Summarize daily, weekly, monthly, or custom periods.
- Compare the week against your trend, plan, and readiness.
The strongest weekly comparison is not just a chart. It is a chart plus intention. Zone Training Log keeps the workout record, zone distribution, and context together so you can answer the real training question: what should happen next?
Conclusion
Compare training weeks by zone by looking at the size of the week, the shape of the week, and the purpose of the workouts inside it. Total time shows volume. Zone minutes show intensity dose. Zone percentages show distribution. Notes, effort, distance, elevation, and planned workouts explain why the distribution happened.
The most useful review ends with a decision. If easy time stayed easy and planned intensity landed well, keep building. If the week was productive but costly, absorb. If moderate or hard time appeared in the wrong places, adjust before the pattern repeats.
That is the point of weekly zone comparison. It turns heart-rate data into a training conversation with yourself: what happened, what changed, and what should the next week do?

Our editorial approach & AI disclosure
We use AI to help research, organize, and draft some articles. Every article is reviewed by a human editor and aims to reflect current evidence-based training practices and scientific literature.
Read our editorial policy